
Decreases in production costs lead to productivity gains for U.S. rice farms
- by William D. McBride
- 2/6/2019
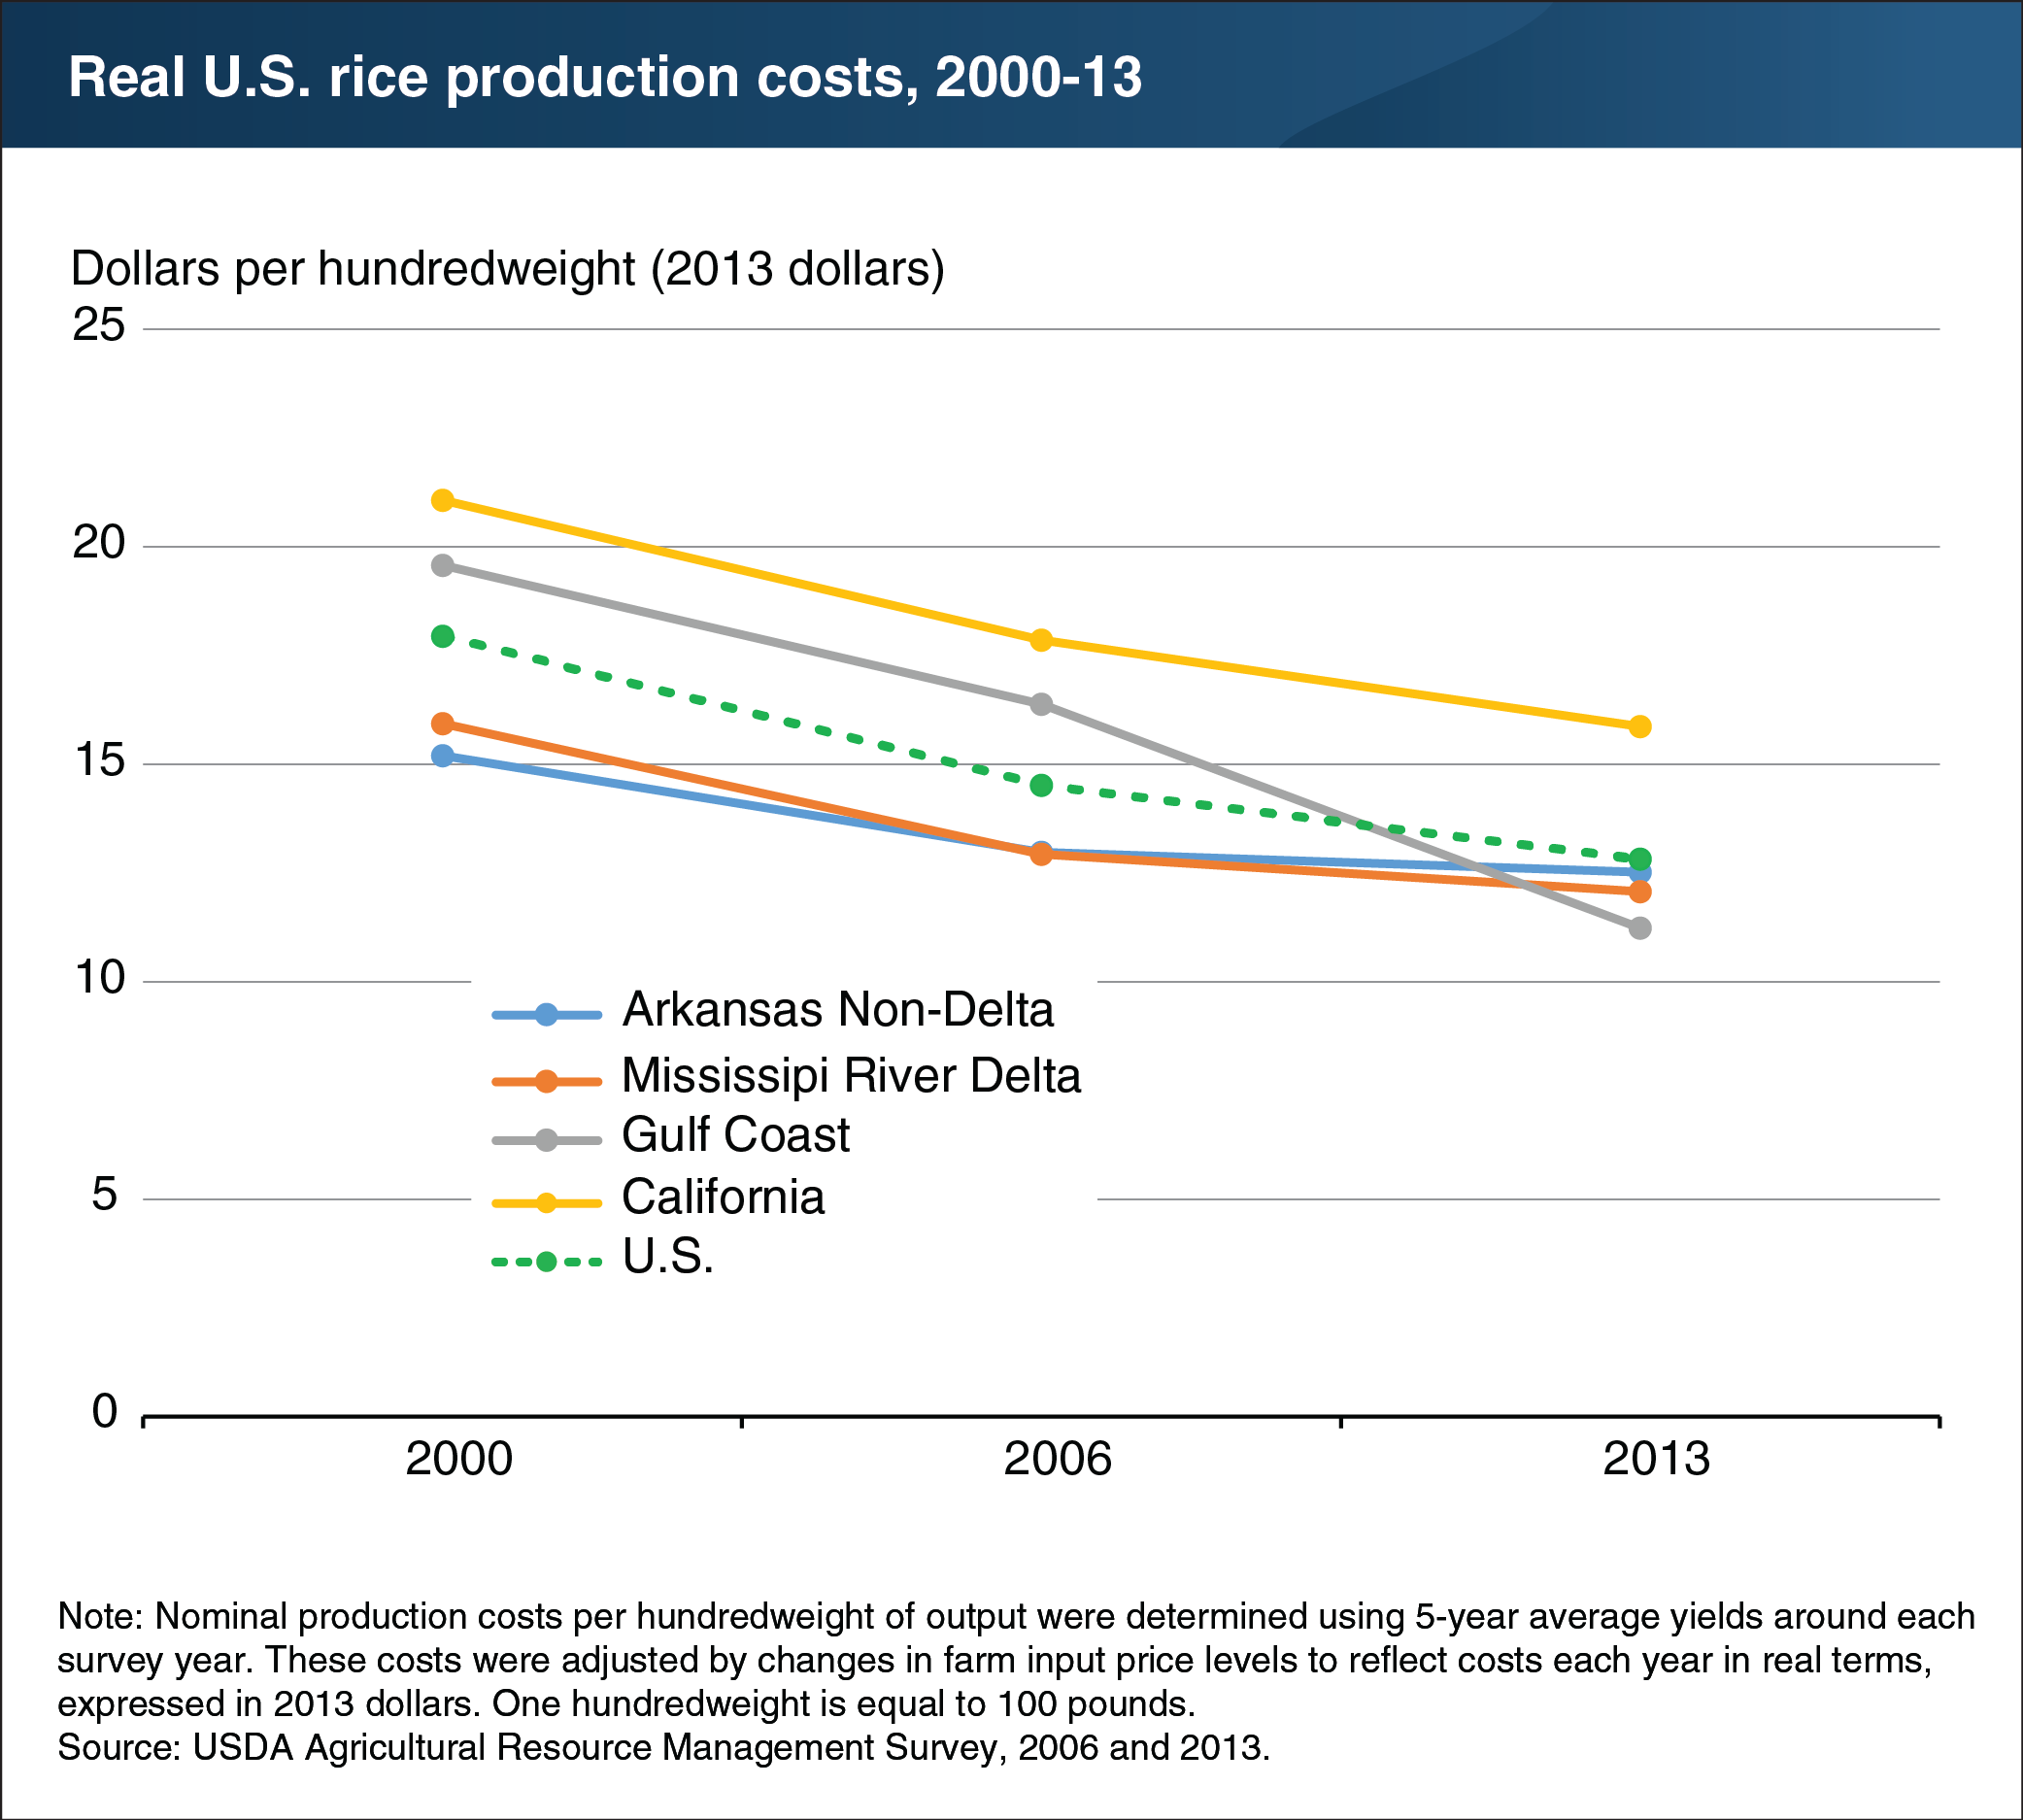
Data from USDA’s Agricultural Resource Management Survey in 2000, 2006, and 2013 were used to measure changes in productivity on U.S. rice farms. Productivity in agriculture is defined as the amount of inputs required to produce a given level of output. A decline in real (inflation-adjusted) production costs implies growth in productivity. Production costs among U.S. rice producers, expressed in 2013 dollars, declined from $17.95 per hundredweight (cwt) in 2000 to $14.52 in 2006 and then to $12.82 in 2013. These changes amount to a total productivity gain of 29 percent, or an average of 2.2 percent per year. Productivity growth in the Gulf Coast region at 43 percent, or about 3 percent per year, was much higher than in the other regions. Among major U.S. field crops during roughly the same timeframe, productivity growth in rice production was second only to that of peanuts. This chart appears in the ERS report. “U.S. Rice Production in the New Millennium: Changes in Structure, Practices, and Costs,” released in December 2018.