
Transportation costs help explain differences in the price of corn in Central Illinois and the Louisiana Gulf Coast
- by David W. Olson
- 10/9/2018
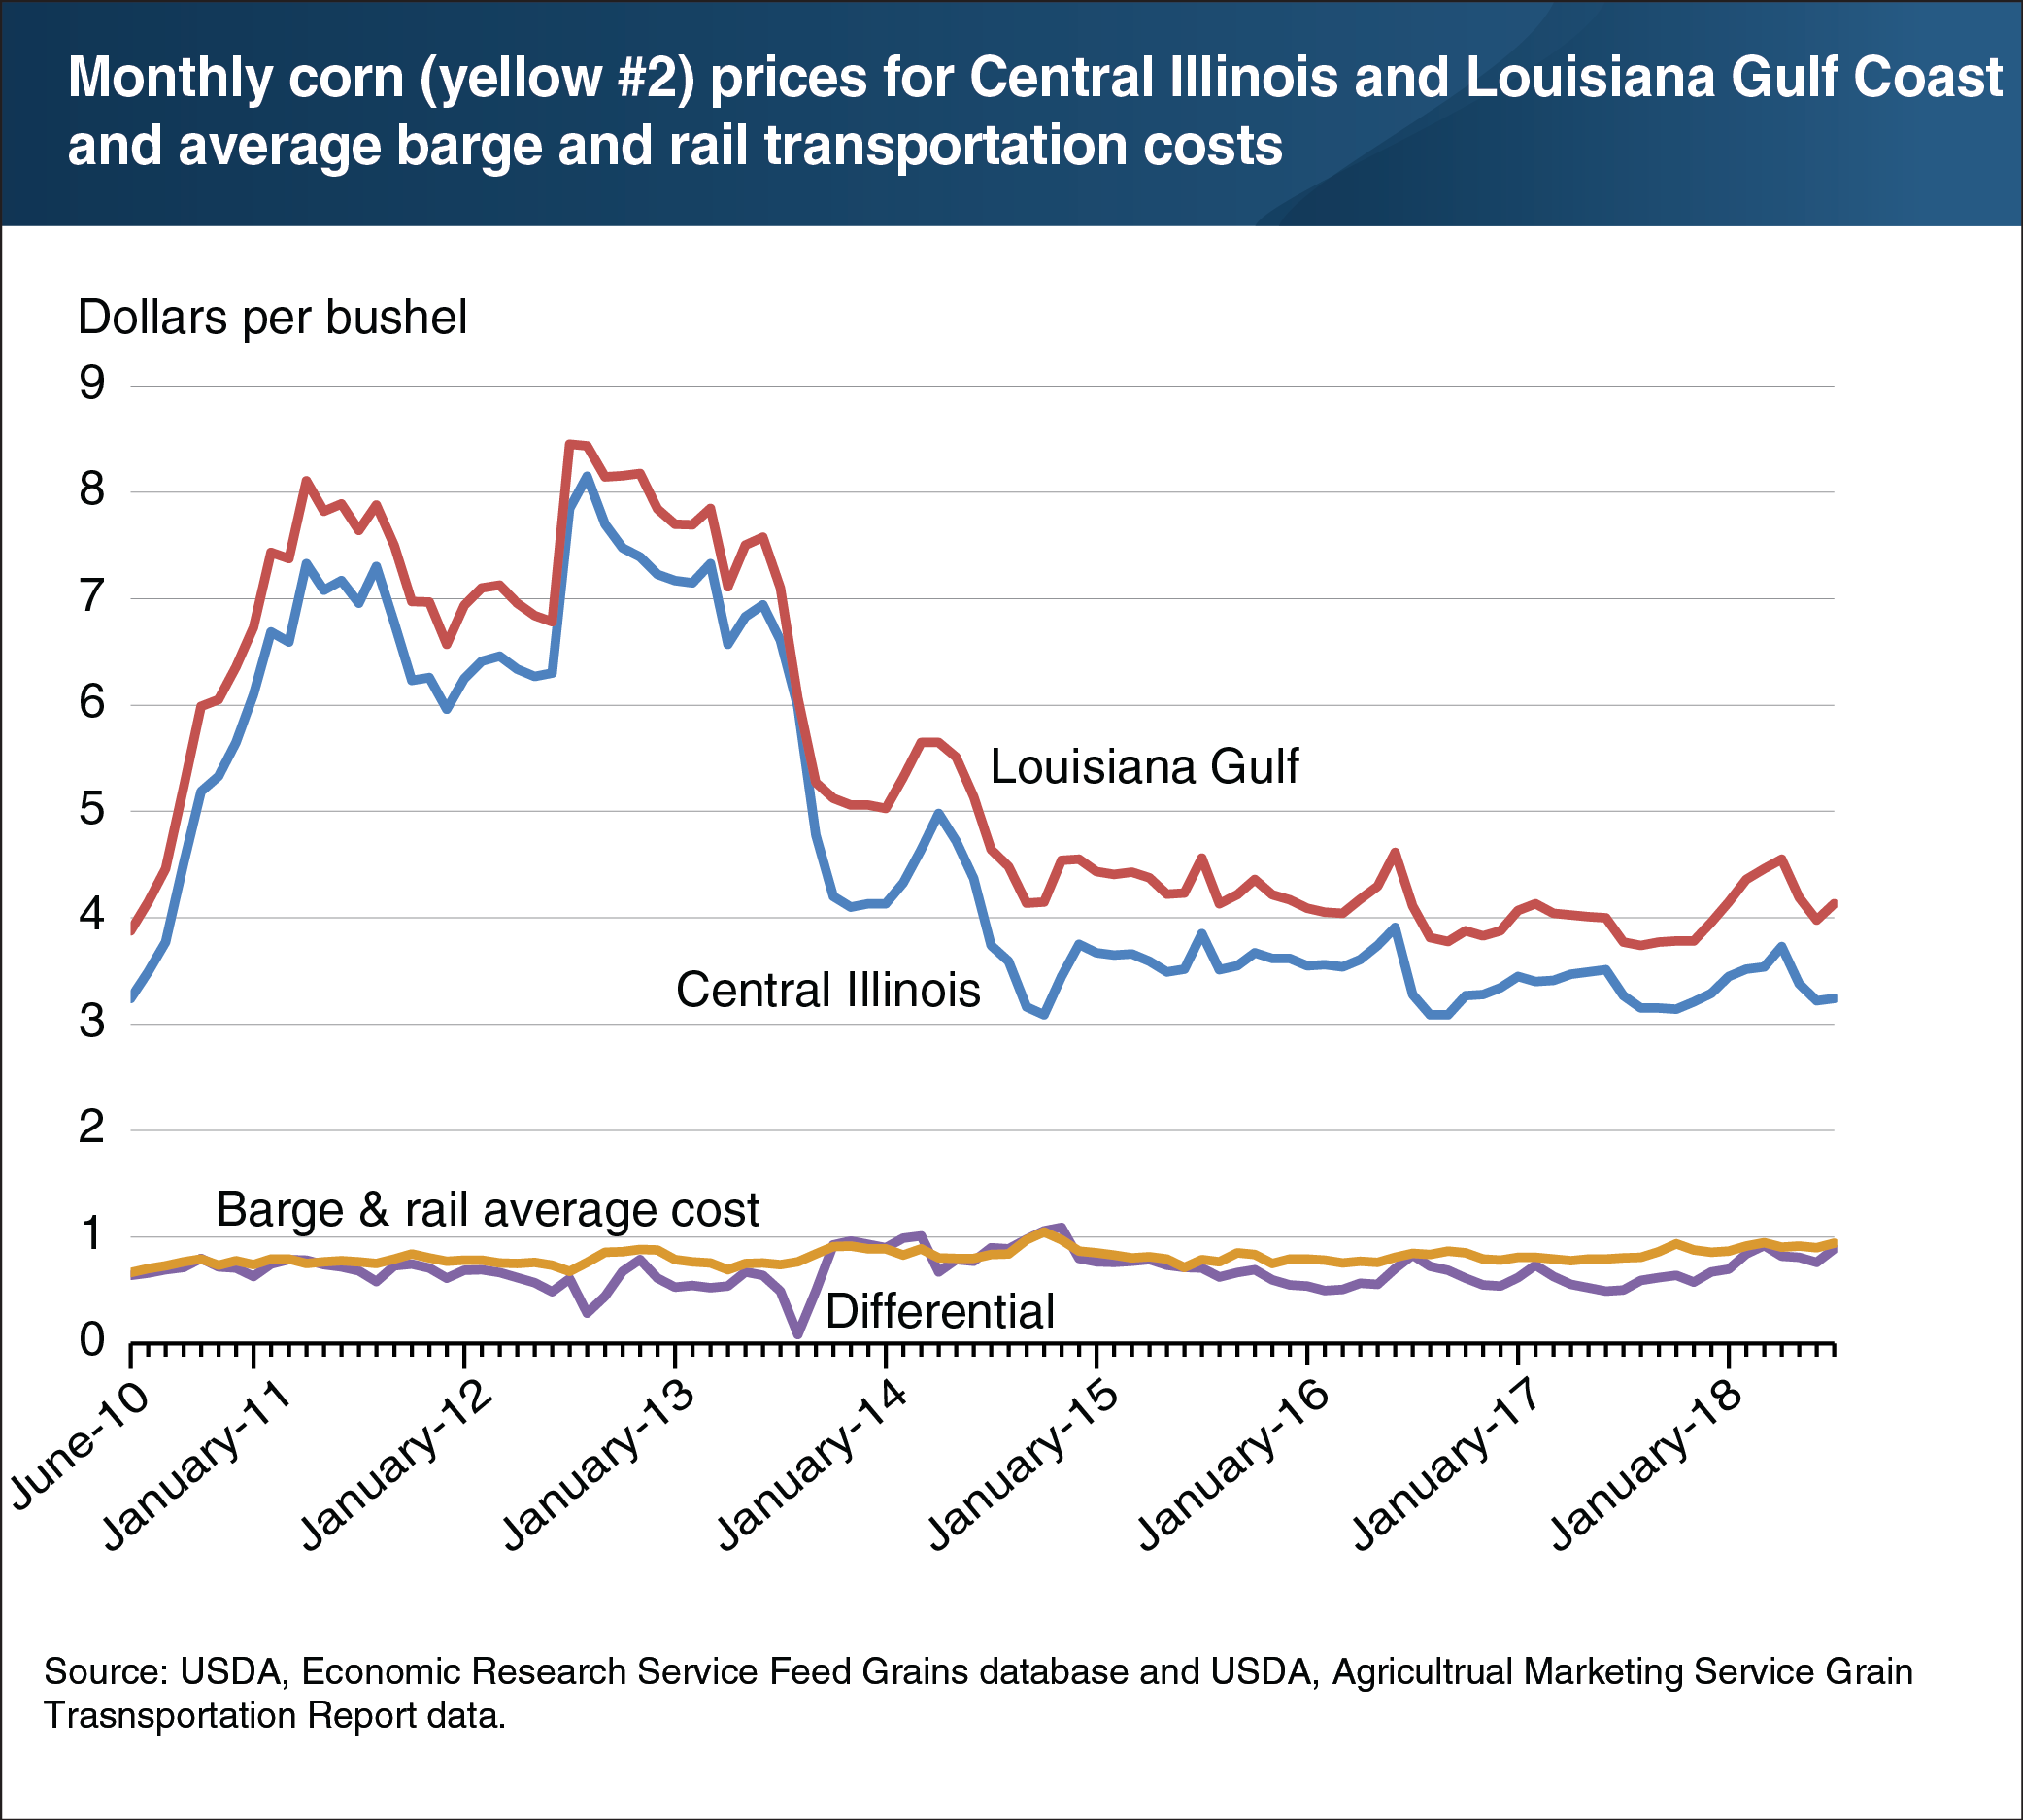
The United States produces large amounts of corn for domestic uses such as animal feed, food use, and ethanol production, but 15 percent of production is exported. USDA data provide wholesale price information for corn (yellow #2 class) sold at different locations in the United States. Two notable points are Central Illinois and the Louisiana Gulf Coast. Corn sold in Central Illinois is often perceived to be destined for domestic markets, while Louisiana Gulf Coast prices are often a reflection of prices for export markets due to the Gulf’s role as a key shipping hub. Since there are no observable differences in yellow #2 corn sold in Illinois and yellow #2 corn sold in Louisiana, it is natural that the difference in prices would reflect the added transportation costs necessary to move corn from major corn-producing states in the Midwest to a Gulf state like Louisiana. An analysis of the difference in price between these two markets shows that the price differential over time closely tracks the average additional costs of rail or barge transportation to the Louisiana Gulf Coast. This chart is drawn from the ERS Feed Outlook newsletter, released in September 2018.