
Although farm wages have increased, labor costs as a share of farm gross cash income remained relatively flat
- by Thomas Hertz
- 7/31/2018
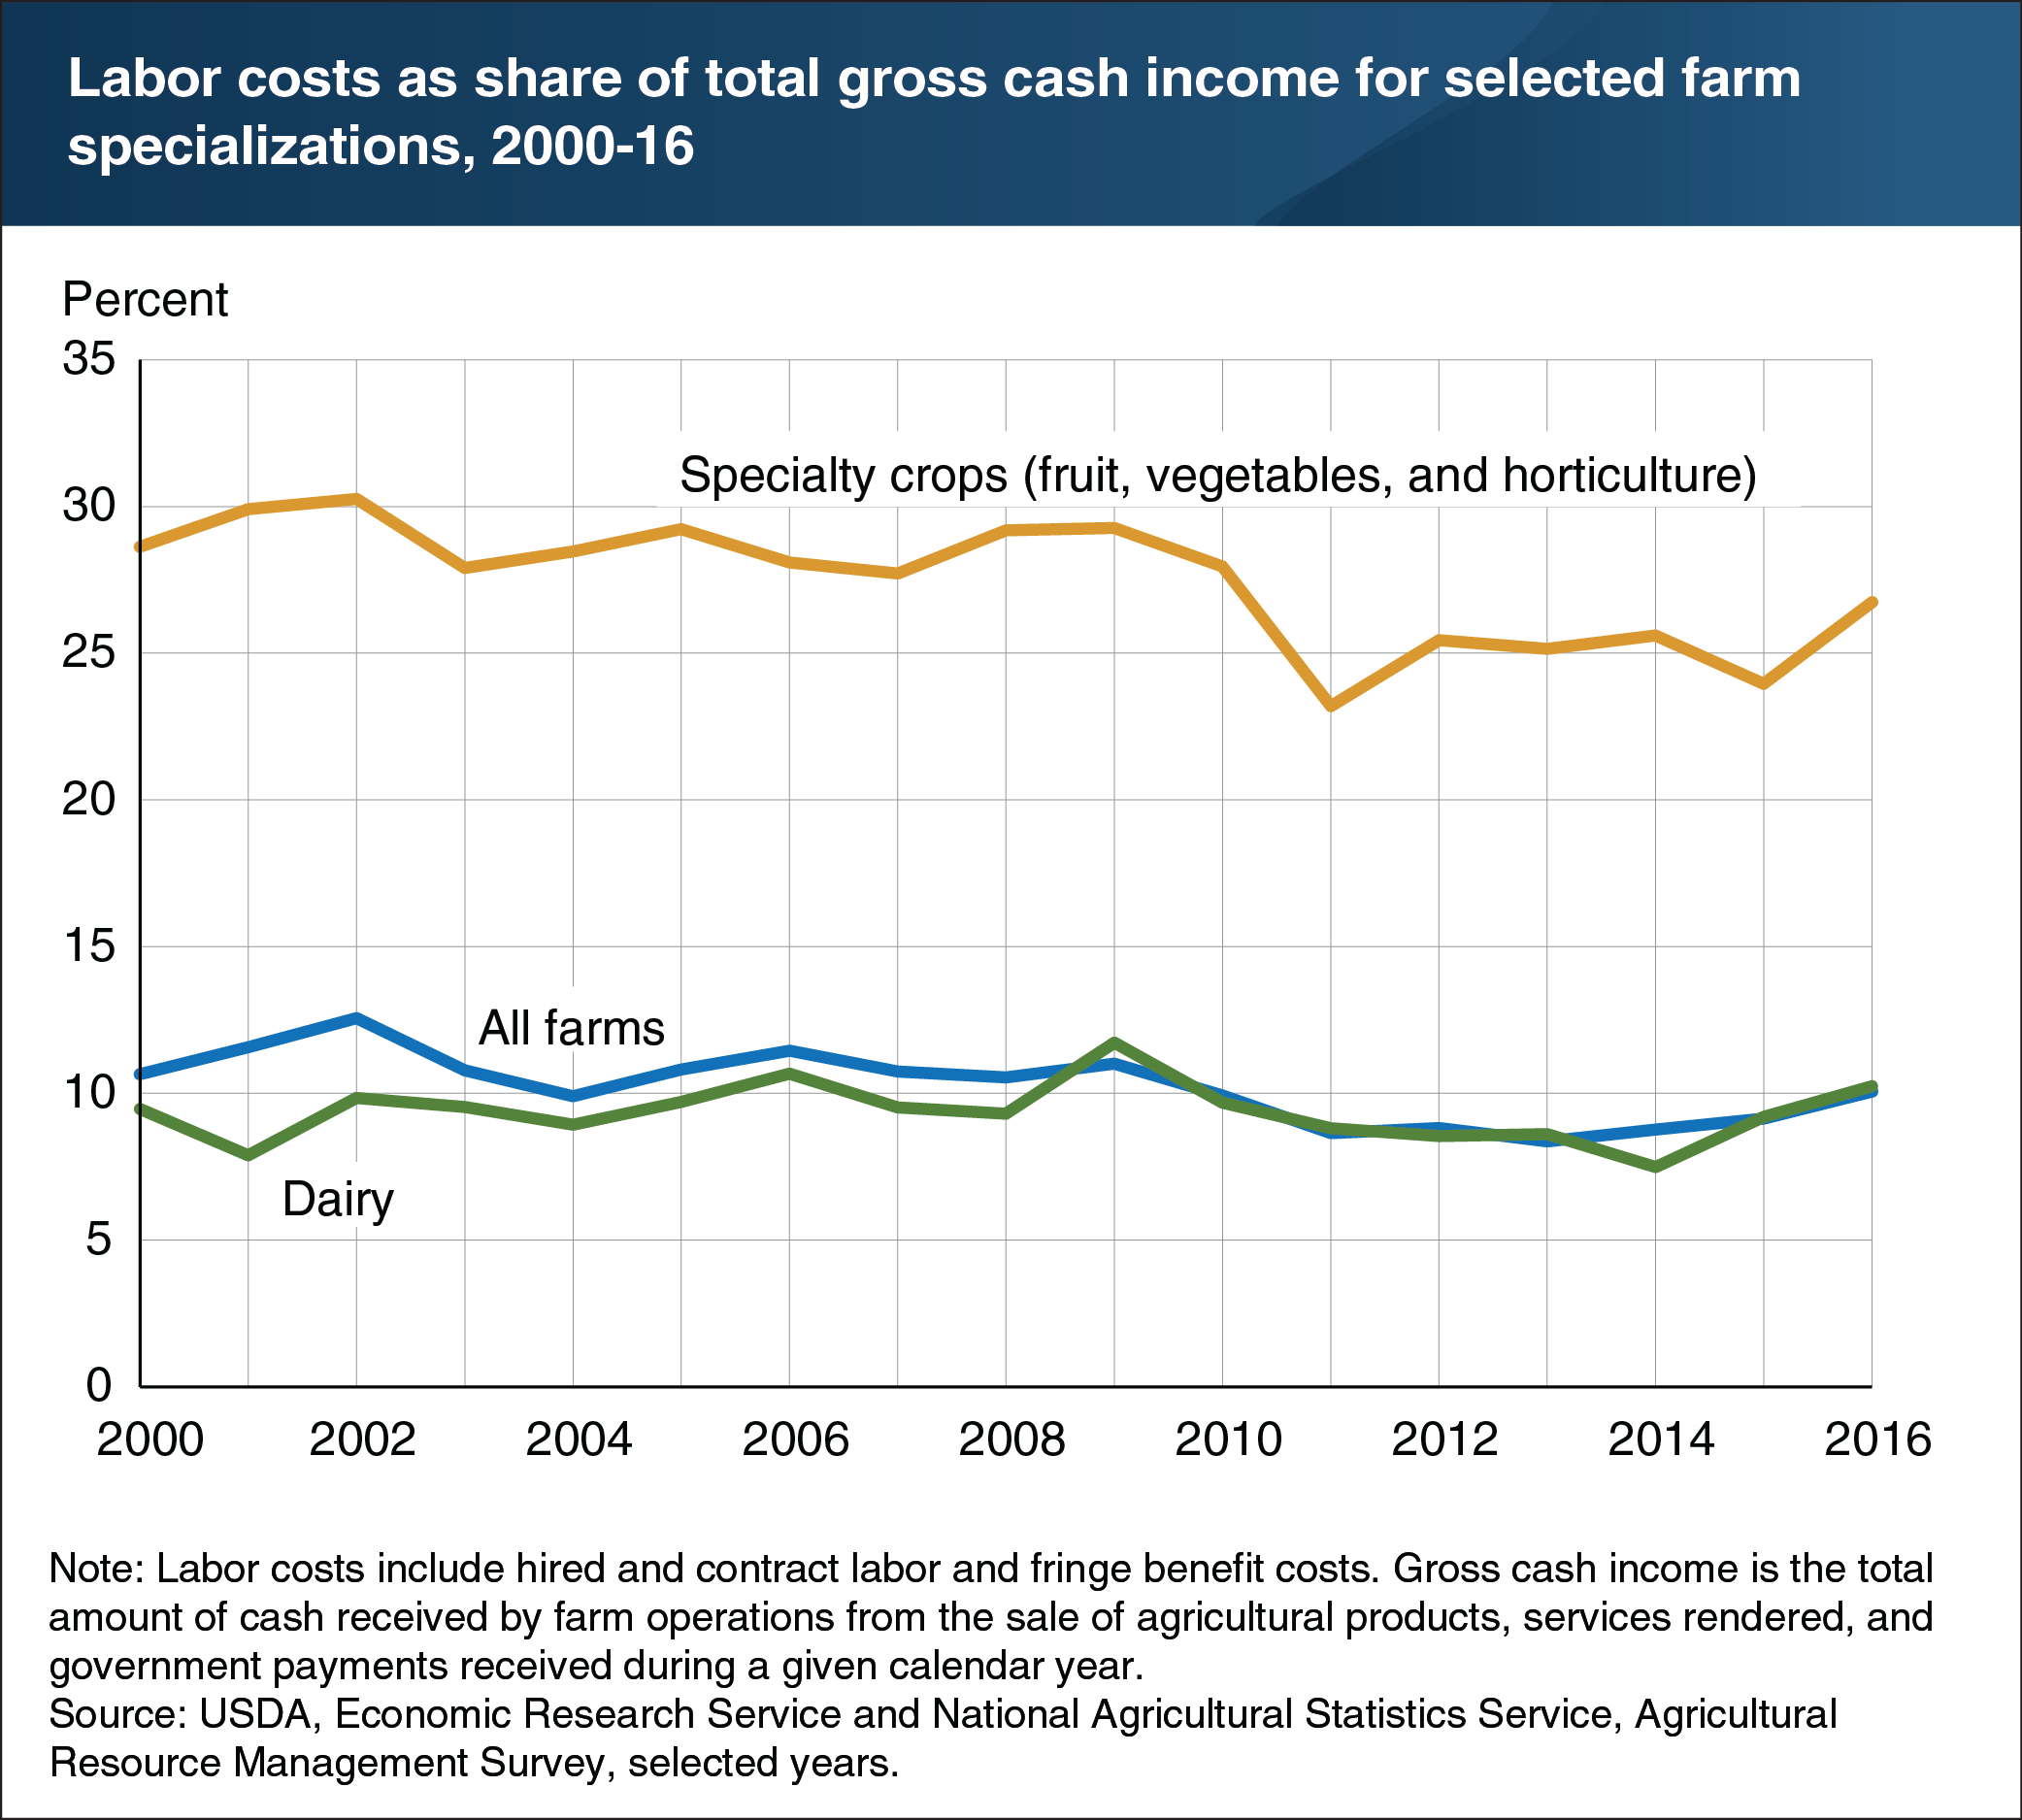
Farm wages have risen since 2000, reaching an annual average of $13.32 per hour in 2017. However, farm labor costs as a share of farm gross cash income do not show an upward trend over 2000-16, as rising wage rates for farm workers have been offset by a number of factors, including rising labor productivity and output prices for some commodities. For all farms, labor costs averaged 10.1 percent of gross cash income in 2016, compared to 10.6 percent in 2000. For the more labor-intensive fruit, vegetable, and horticulture operations, labor costs in 2016 amounted to 26.7 percent of gross cash income, compared to 28.6 percent in 2000. For farms specializing in dairy, the labor cost share of gross cash income was 10.2 percent in 2016, compared to 9.5 percent in 2000. This chart appears in the ERS topic page for Farm Labor, updated May 2018.