
California leads in number of U.S. food and beverage processing plants
- by Stephen Martinez
- 6/21/2018
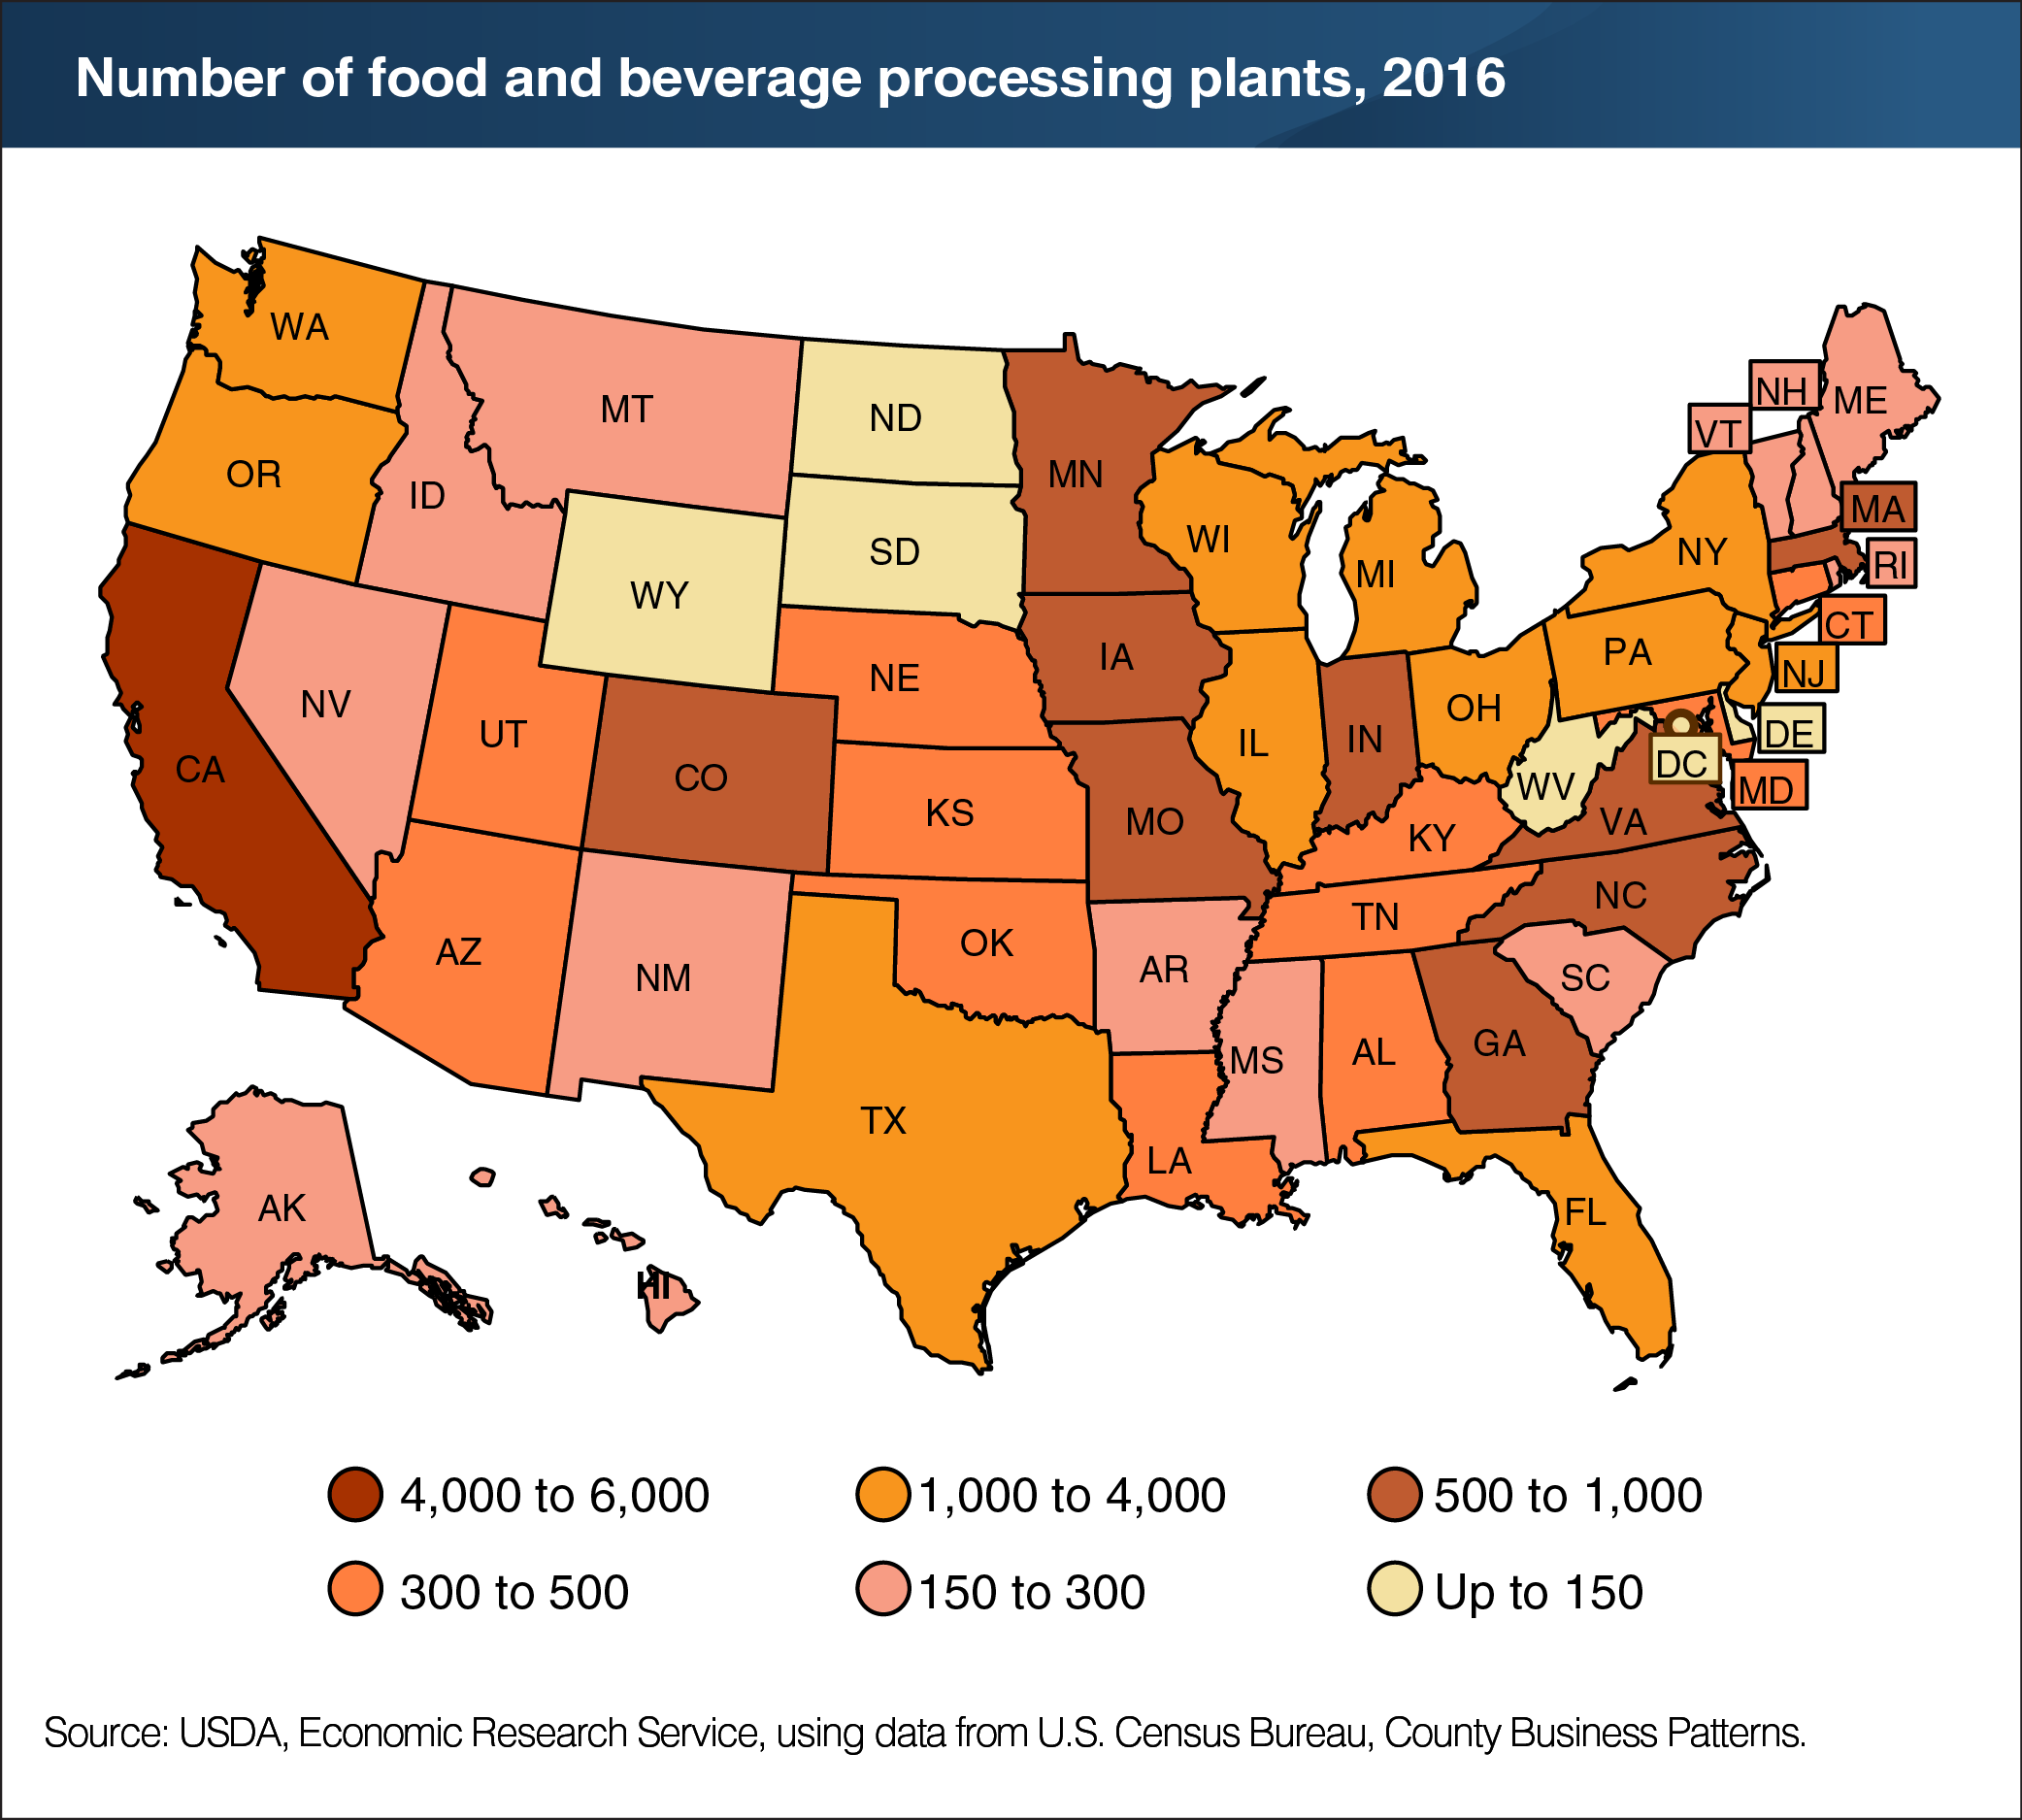
In 2016, there were 35,457 food and beverage processing plants located throughout the United States, employing more than 1.5 million people. California had the most food and beverage processing plants (5,639), followed by New York (2,578) and Texas (2,252). These States were also the top three States in number of total manufacturing plants in 2016 and were among the four most populated States. California and Texas also ranked among the top four States in agricultural production in 2016. California holds an important national position in several food processing industries—including fruit and vegetables, sugar, wine, and coffee—because of its favorable climate for growing a variety of crops and other factors, such as its large ports and other infrastructure. The State also has numerous dairy processing plants to serve its large population and those of other States. In New York, bakery manufacturing accounted for the most food and beverage processing plants, followed by wineries and breweries in 2016. Bakery manufacturing and animal slaughter and processing industries accounted for 40 percent of Texan food and beverage processing plants in 2016. This chart appears in the Processing & Marketing topic page on the ERS website.