

The United States is forecast to remain a relatively small importer of most red meats and dairy products in 2018
- by Mildred Haley
- 3/30/2018
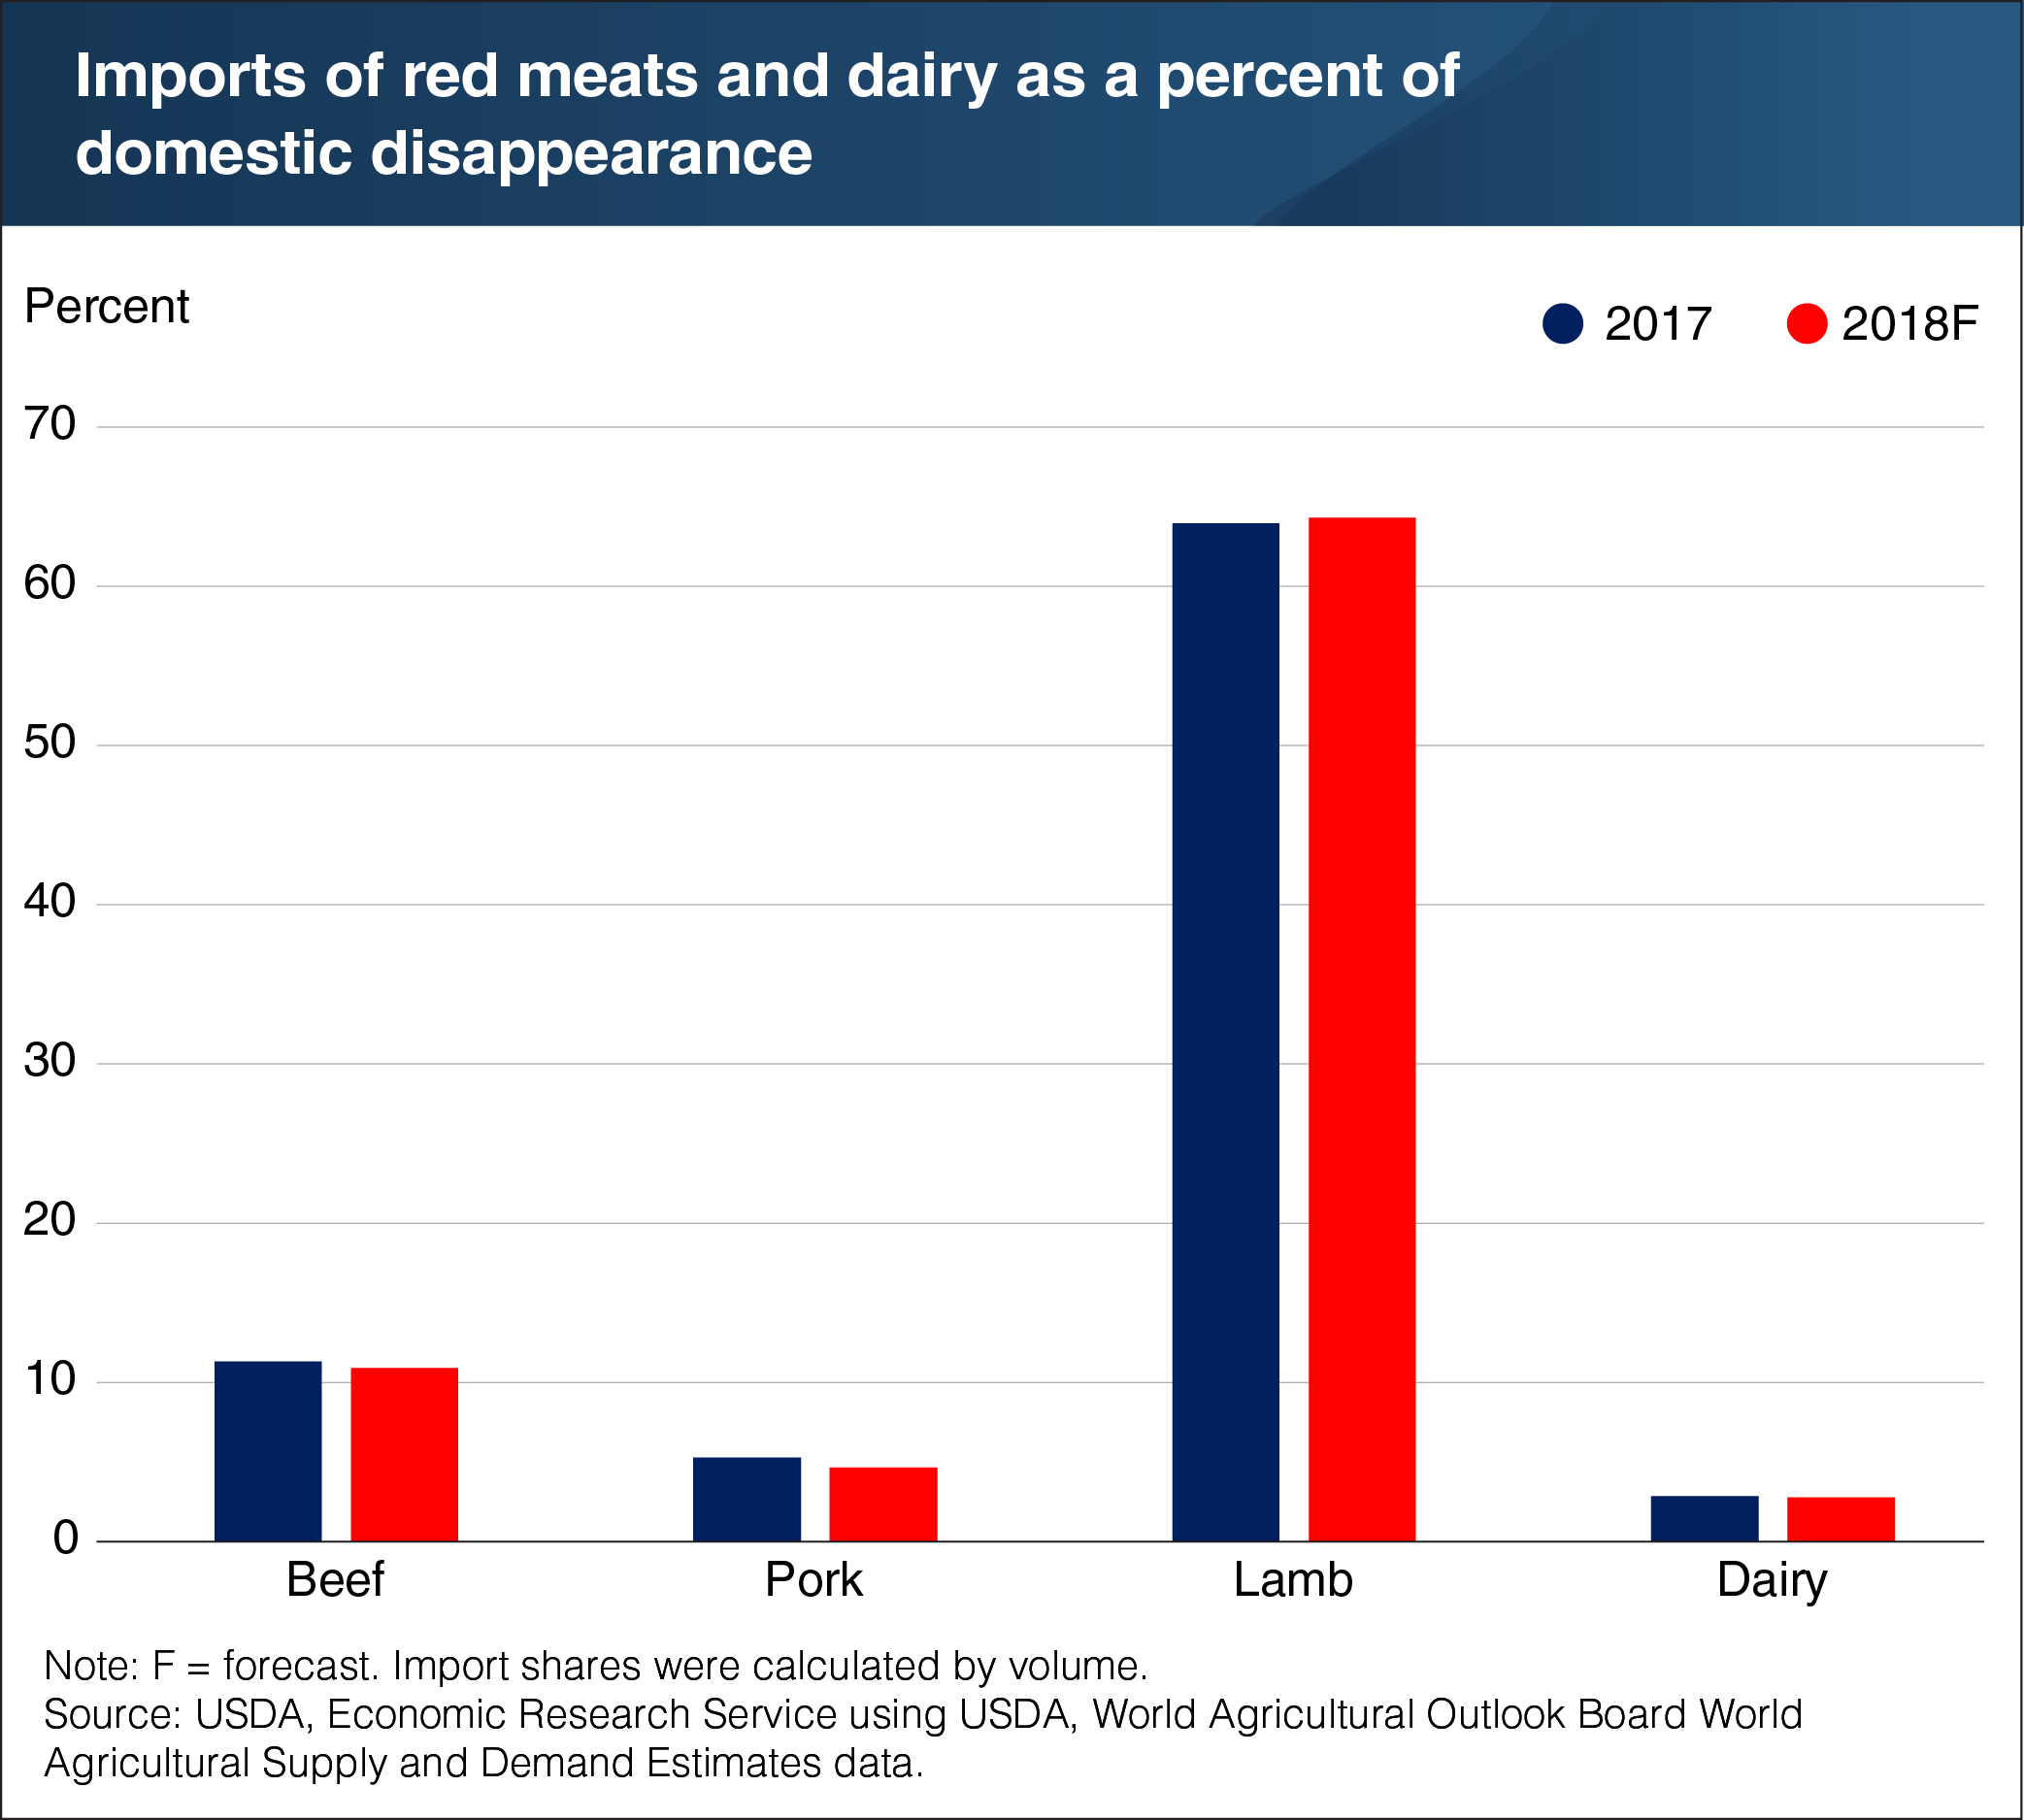
Consistent with past years, import data for all of 2017 show that, the United States is a relatively small meat and dairy products importer. USDA import forecasts for 2018 show an extension of this tendency. In 2017, U.S. beef imports were 11.3 percent of total domestic disappearance. In 2018, forecasts for U.S. beef imports leave the ratio almost unchanged (10.9 percent). The United States imports mostly lean beef from Australia, mainly for final use as hamburger and in processed and prepared food products. On the pork side, imports accounted for just over 5 percent of disappearance last year. Based on forecasts, that ratio is expected to be somewhat smaller this year—4.6 percent—due largely to increased domestic production. Most imported pork comes from Canada and the European Union (EU). Compared with beef, pork, and dairy products, lamb imports typically account for more than half of domestic disappearance. Most U.S. lamb imports originate from Oceania. In 2017, imports made up about 64 percent of disappearance. This year, the ratio is expected to be roughly the same. For imported dairy products—most of which come from the EU and New Zealand—imports comprised about 3 percent of U.S. disappearance last year and is expected to be similar in 2018. This chart appears in the ERS Livestock, Dairy, and Poultry Outlook Newsletter, released in March 2018.