
U.S. per capita fresh pear use continues to decline
- by Agnes Perez
- 10/27/2017
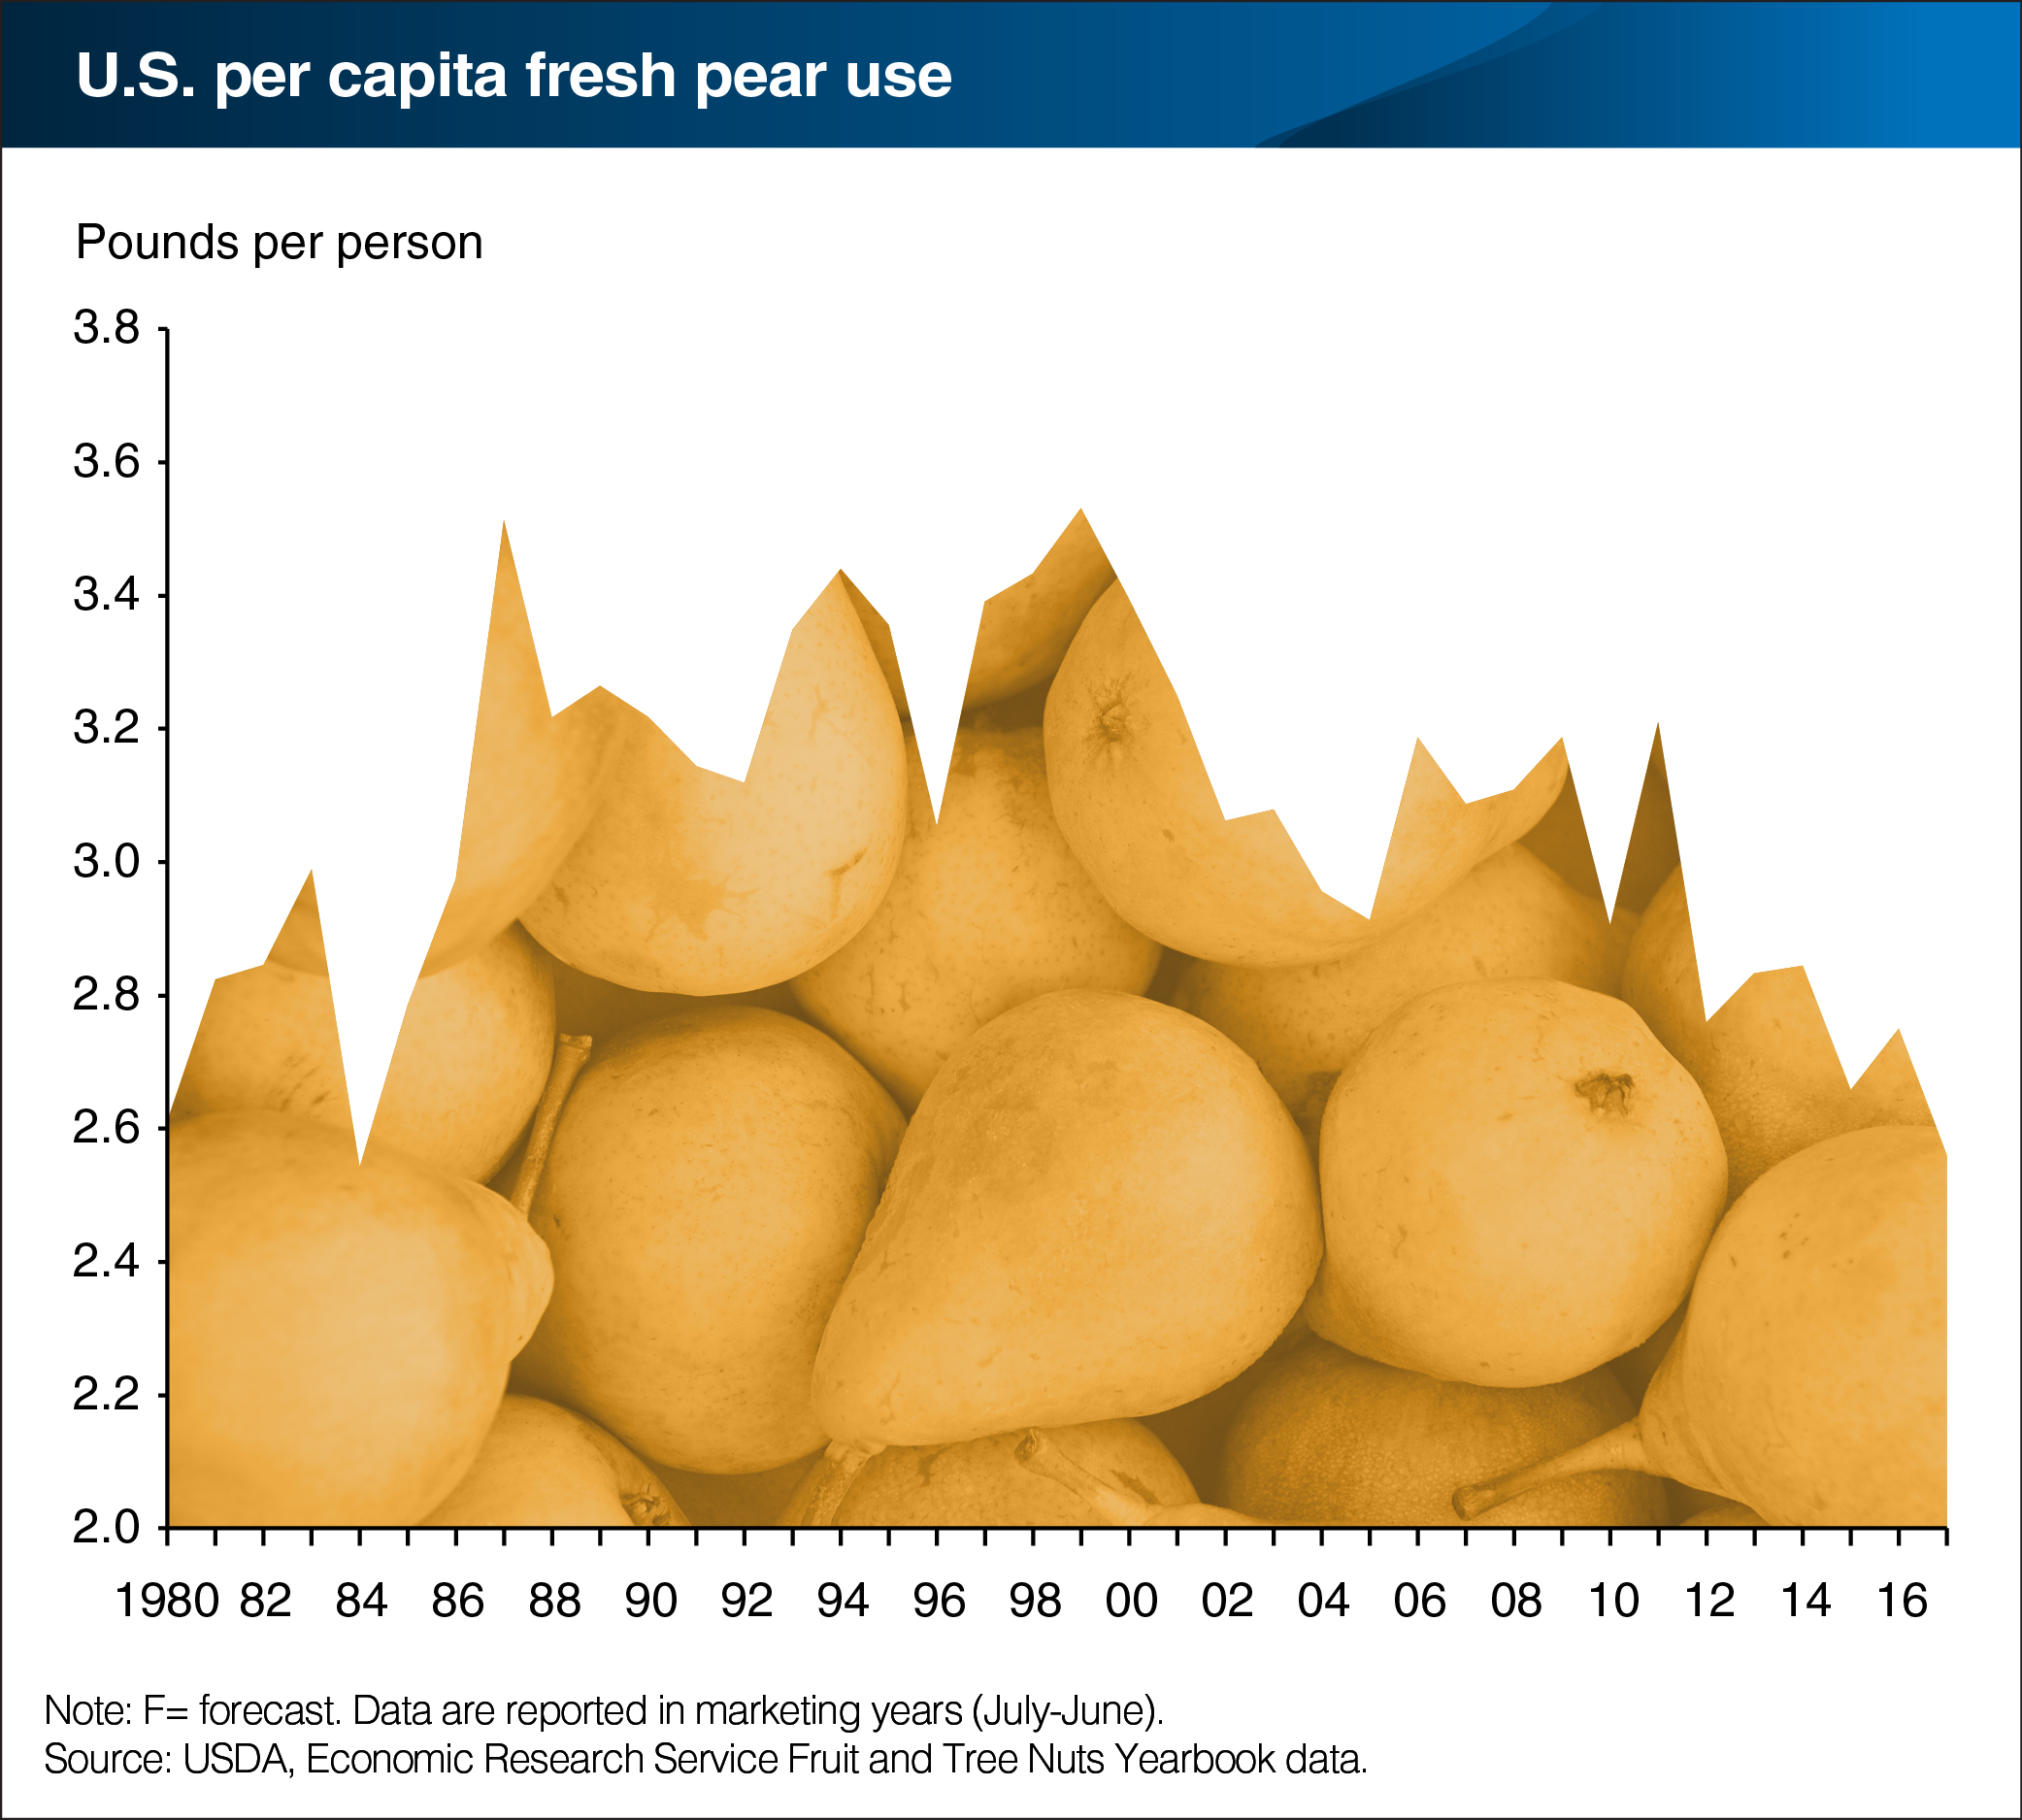
In August, USDA forecast the 2017 U.S. pear crop to decline for a fourth consecutive year to 1.41 billion pounds, down 4 percent from the previous year. If realized, this year’s production will be the smallest production reported since 1980, pointing to stronger pear prices during the 2017/18 marketing season (July-June). Forecast lower production in Washington State (down 20 percent from the previous year), the largest pear-producing State, is driving the smaller overall U.S. crop. One cause for Washington State and the greater Pacific Northwest’s decline, was a long winter and cold spring, which delayed the growth of pears during that period. Declining production and higher prices have translated into reduced per capita pear consumption, which has trended downward for most of the last 20 years except for a temporary resurgence in the mid-2000s. Higher prices from lower pear output in 2017 are expected to diminish demand, leading to a projected per capita use of just over 2.5 pounds per person. This would be the lowest total since 1984. This chart appears in the ERS Fruit and Tree Nuts Outlook newsletter, released on September 29, 2017.