
Manufacturing employment declines were highest in the Eastern United States between 2001 and 2015
- by Sarah A. Low
- 8/22/2017
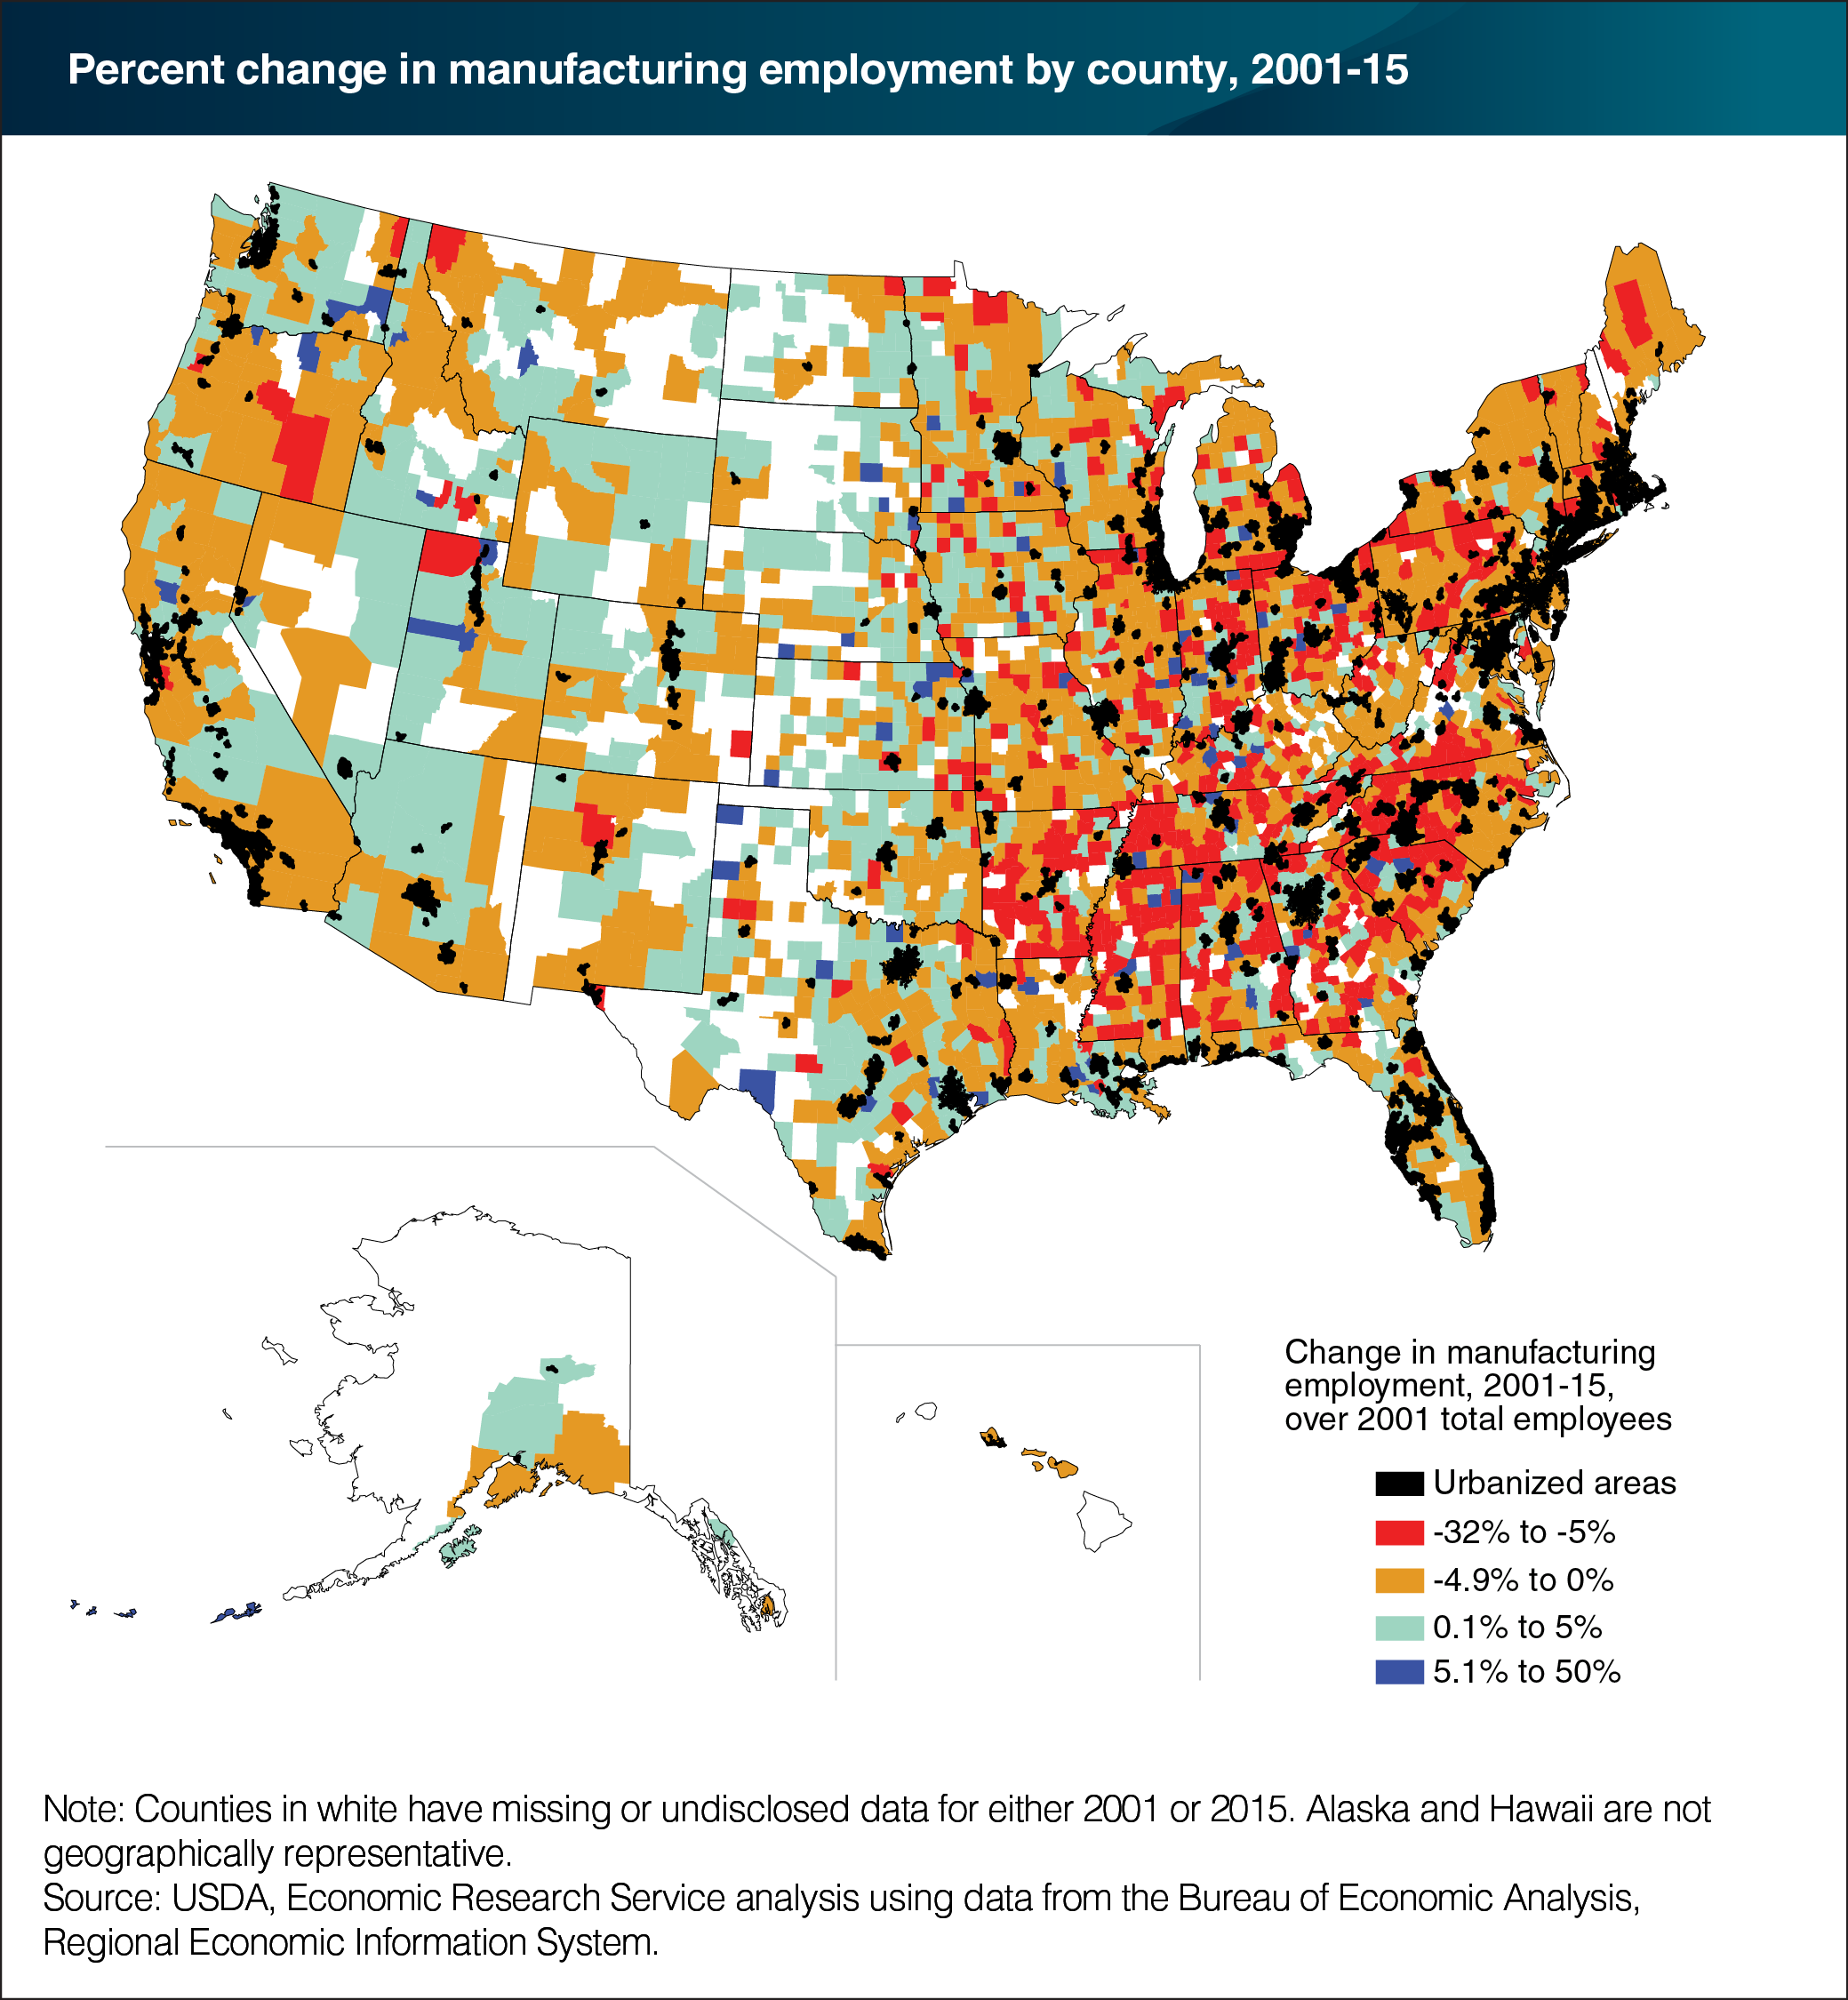
Manufacturing provides more jobs in rural America than many other sectors. In 2015, rural manufacturing jobs totaled 2.5 million, compared to 1.4 million farm jobs. Rural manufacturing jobs were also about equal to rural retail jobs, almost double rural construction jobs, and five times rural mining (including oil and gas extraction) jobs. However, U.S. manufacturing employment has been declining since the 1950s. Between 2001 and 2015—a period that included the recessions of 2001 and 2007-09—manufacturing employment fell by close to 30 percent. In addition, 71 percent of U.S. counties experienced a decline in manufacturing employment. Counties with the largest relative declines were concentrated in the Eastern United States, the traditional hub of U.S. manufacturing. In 2015, almost 20 percent of manufacturing jobs were located in rural counties. Factors such as globalization and rapid changes in technology have contributed to the decline in U.S. manufacturing employment. This chart appears in the ERS report Rural Manufacturing at a Glance, released August 2017.
We’d welcome your feedback!
Would you be willing to answer a few quick questions about your experience?