
Percent of residents receiving SNAP benefits in 2016 varied across States, reflecting differences in need and program policies
- by Laura Tiehen
- 6/26/2017
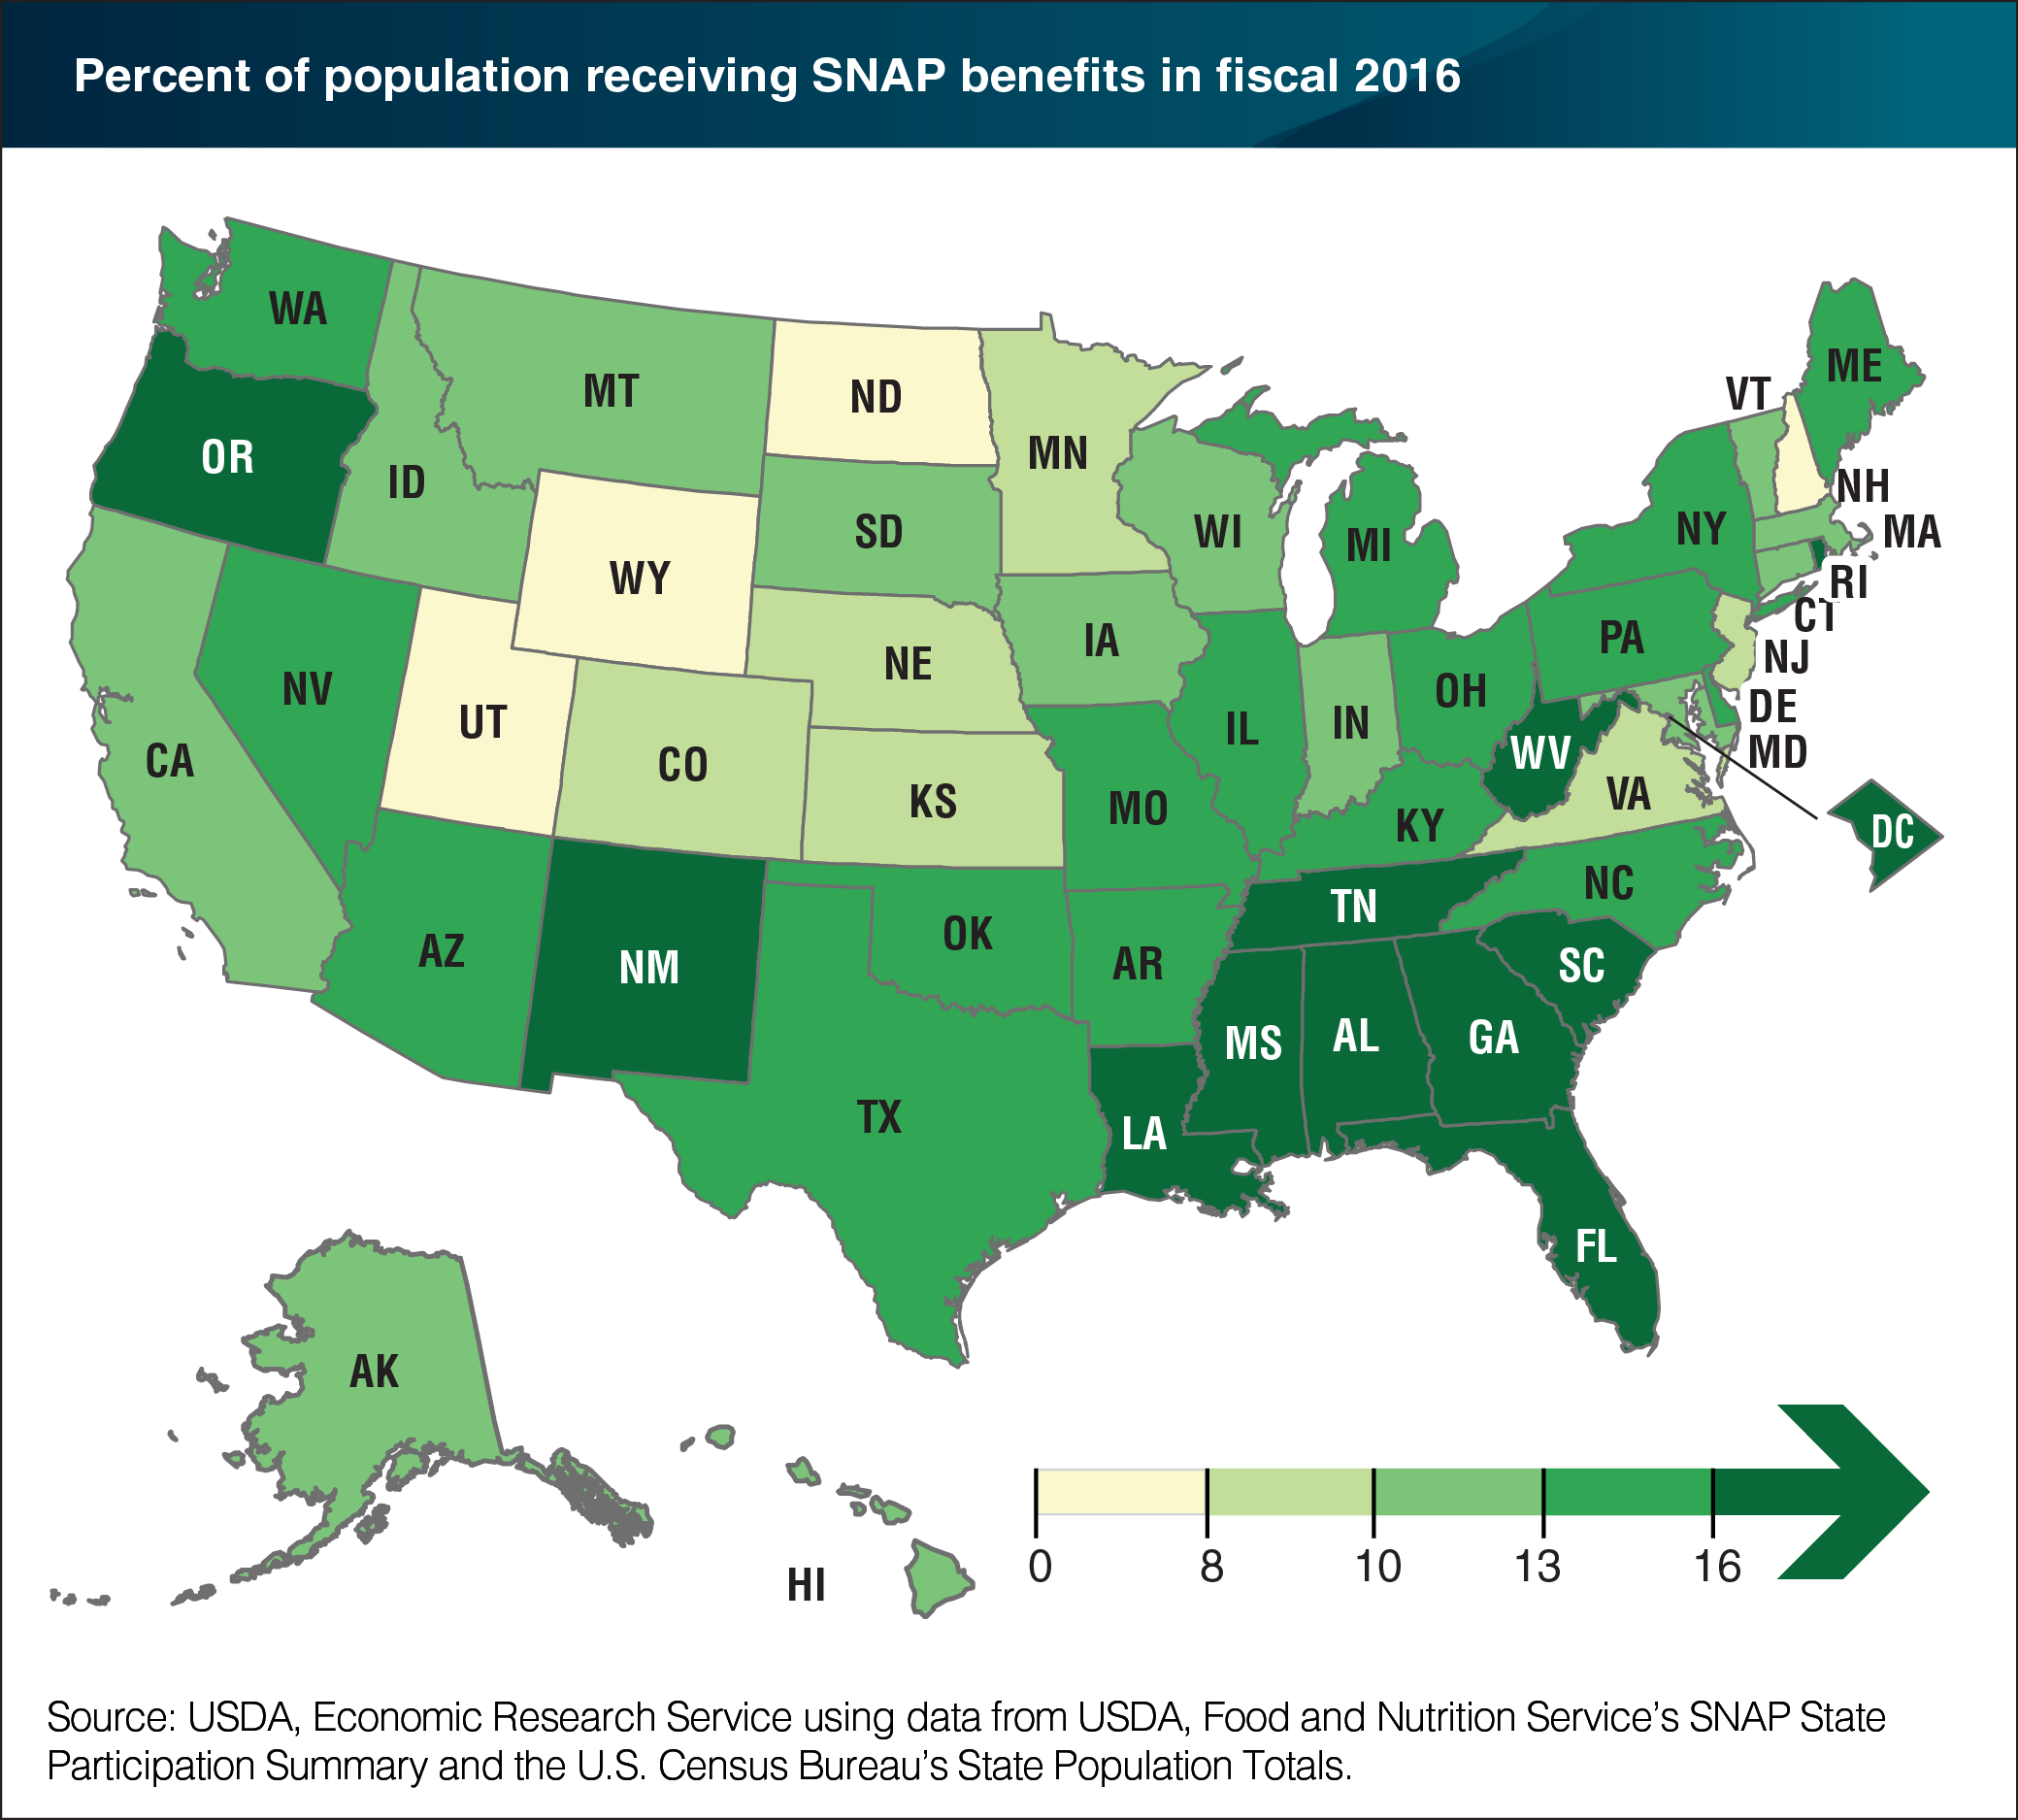
USDA’s Supplemental Nutrition Assistance Program (SNAP) served an average of 44.2 million people per month in fiscal 2016. The percent of Americans participating in the program declined from 15.0 in 2013 to 13.7 in 2016, marking the third consecutive year of a decline in the percent of the population receiving SNAP. Between 2015 and 2016, 41 States and the District of Columbia saw a decrease in the percent of residents receiving SNAP benefits, while 9 States experienced no change or increases. The percent of State populations receiving SNAP benefits ranged from a low of 5.8 in Wyoming to a high of 22.6 in New Mexico, reflecting differences in need and in program policies. Southeastern States have a particularly high share of residents receiving SNAP benefits, with participation rates of 15.0 to 19.5 percent. Kentucky had the largest decline from 2015 to 2016, with the percent of residents receiving SNAP decreasing from 17.4 to 15.0 percent. This chart appears in ERS’s Selected charts Ag and Food Statistics: Charting the Essentials, 2017, April 2017.
We’d welcome your feedback!
Would you be willing to answer a few quick questions about your experience?