
U.S. agricultural exports have historically exceeded imports, leading to trade surplus
- by Alex Melton and Bryce Cooke
- 5/18/2017
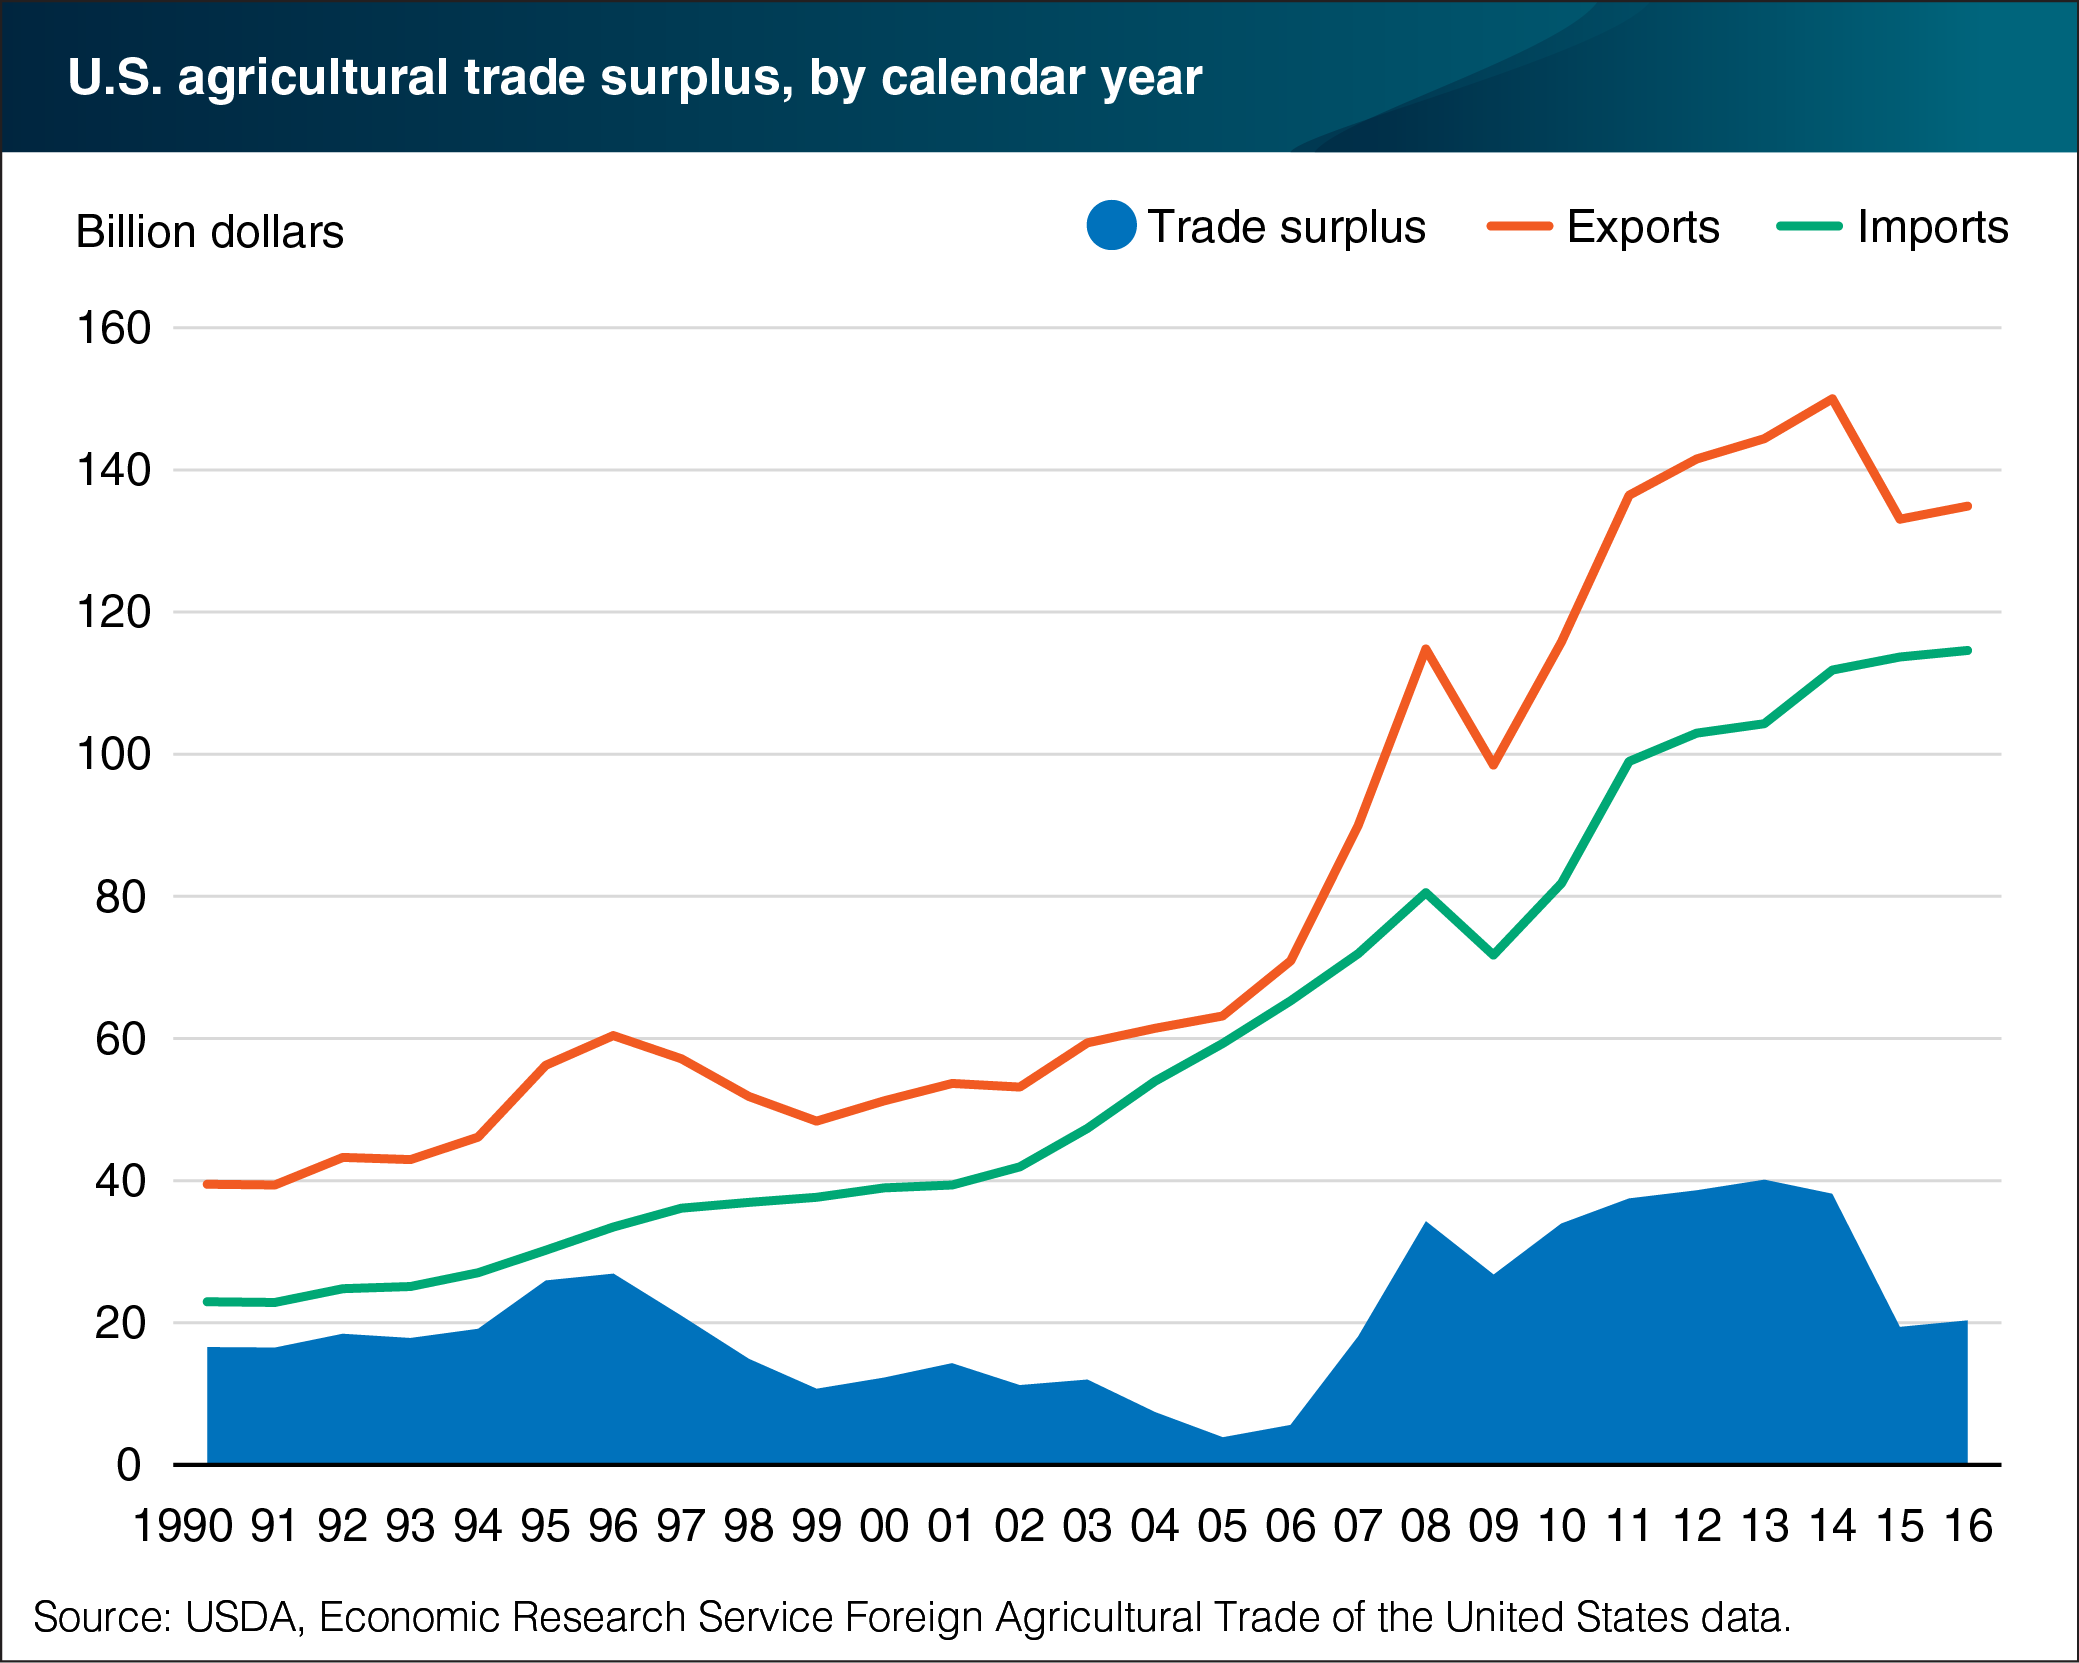
The United States has had a surplus in agricultural trade every year since 1959. Agricultural exports have accounted for 10 to 11 percent of total U.S. exports in recent years, while agricultural imports accounted for about 5 percent of total imports. The result is that agriculture has become a reliable trade surplus sector, but the size of the surplus has varied greatly recently. U.S. imports generally have tended to rise more smoothly because the United States has a developed, stable economy with a preference for out-of-season goods and high-value items. Meanwhile, the country’s major export commodities include soybeans, corn, and wheat. These crops have trade figures that tend to fluctuate more in response to price changes because there is little to differentiate between the U.S. and its competitors’ raw goods, compared to higher value processed products. This chart appears in the ERS Amber Waves data feature, U.S. Agricultural Trade in 2016: Major Commodities and Trends, released in May 2017.