
SNAP participation and per person benefits both fell in 2016
- by Victor Oliveira
- 4/5/2017
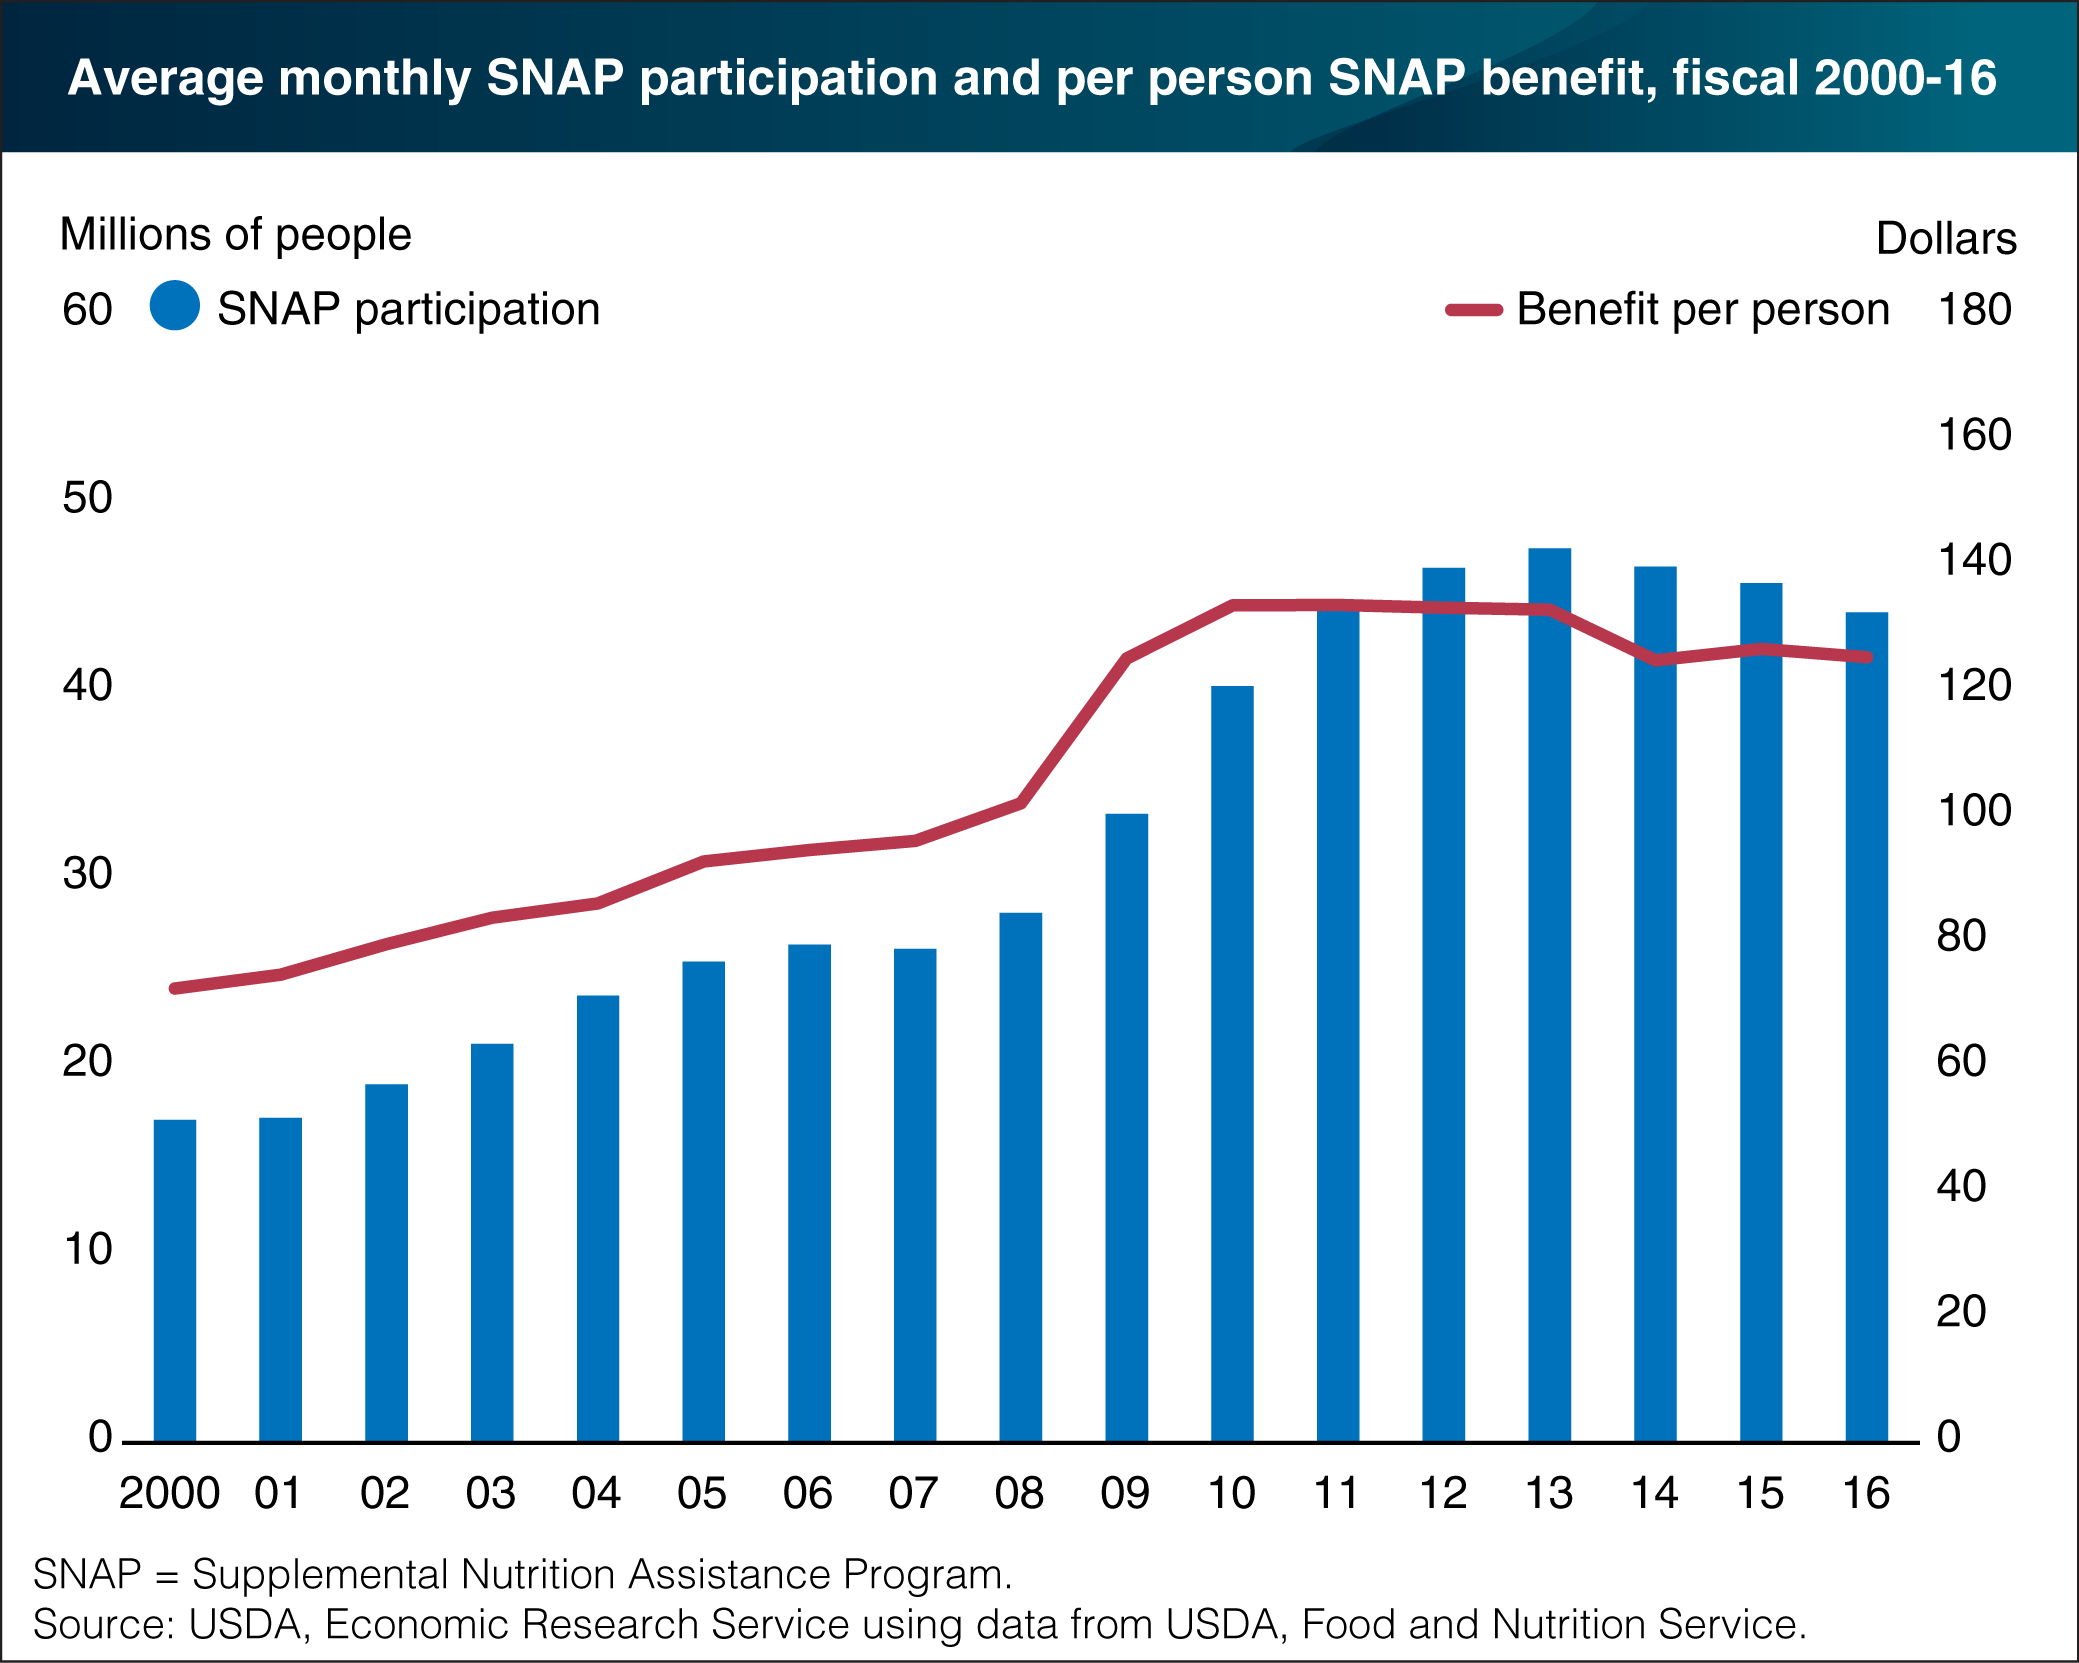
The Supplemental Nutrition Assistance Program (SNAP) is the cornerstone of USDA’s food and nutrition assistance programs, accounting for 69 percent of all Federal food and nutrition assistance spending in fiscal 2016. An average 44.2 million people per month participated in the program in fiscal 2016, 3 percent fewer than the previous fiscal year and the third consecutive year of declining participation. Fiscal 2016’s caseload was the fewest SNAP participants since fiscal 2010 and 7 percent less than the 47.6 million participants per month in fiscal 2013. The decrease in 2016 was likely due in part to the country’s continued economic growth as well as the reinstatement in many States of the time limit—3 months of SNAP benefits within any 3-year period—on participation for able-bodied adults without dependents. Per person benefits averaged $125.51 per month in fiscal 2016, 1 percent less than the previous fiscal year and 6 percent less than the historical high of $133.85 set in fiscal 2011. This chart appears in the ERS report, The Food Assistance Landscape: FY 2016 Annual Report, released on March 30, 2017.