
SNAP increasingly serves the working poor
- by Laura Tiehen
- 3/14/2017
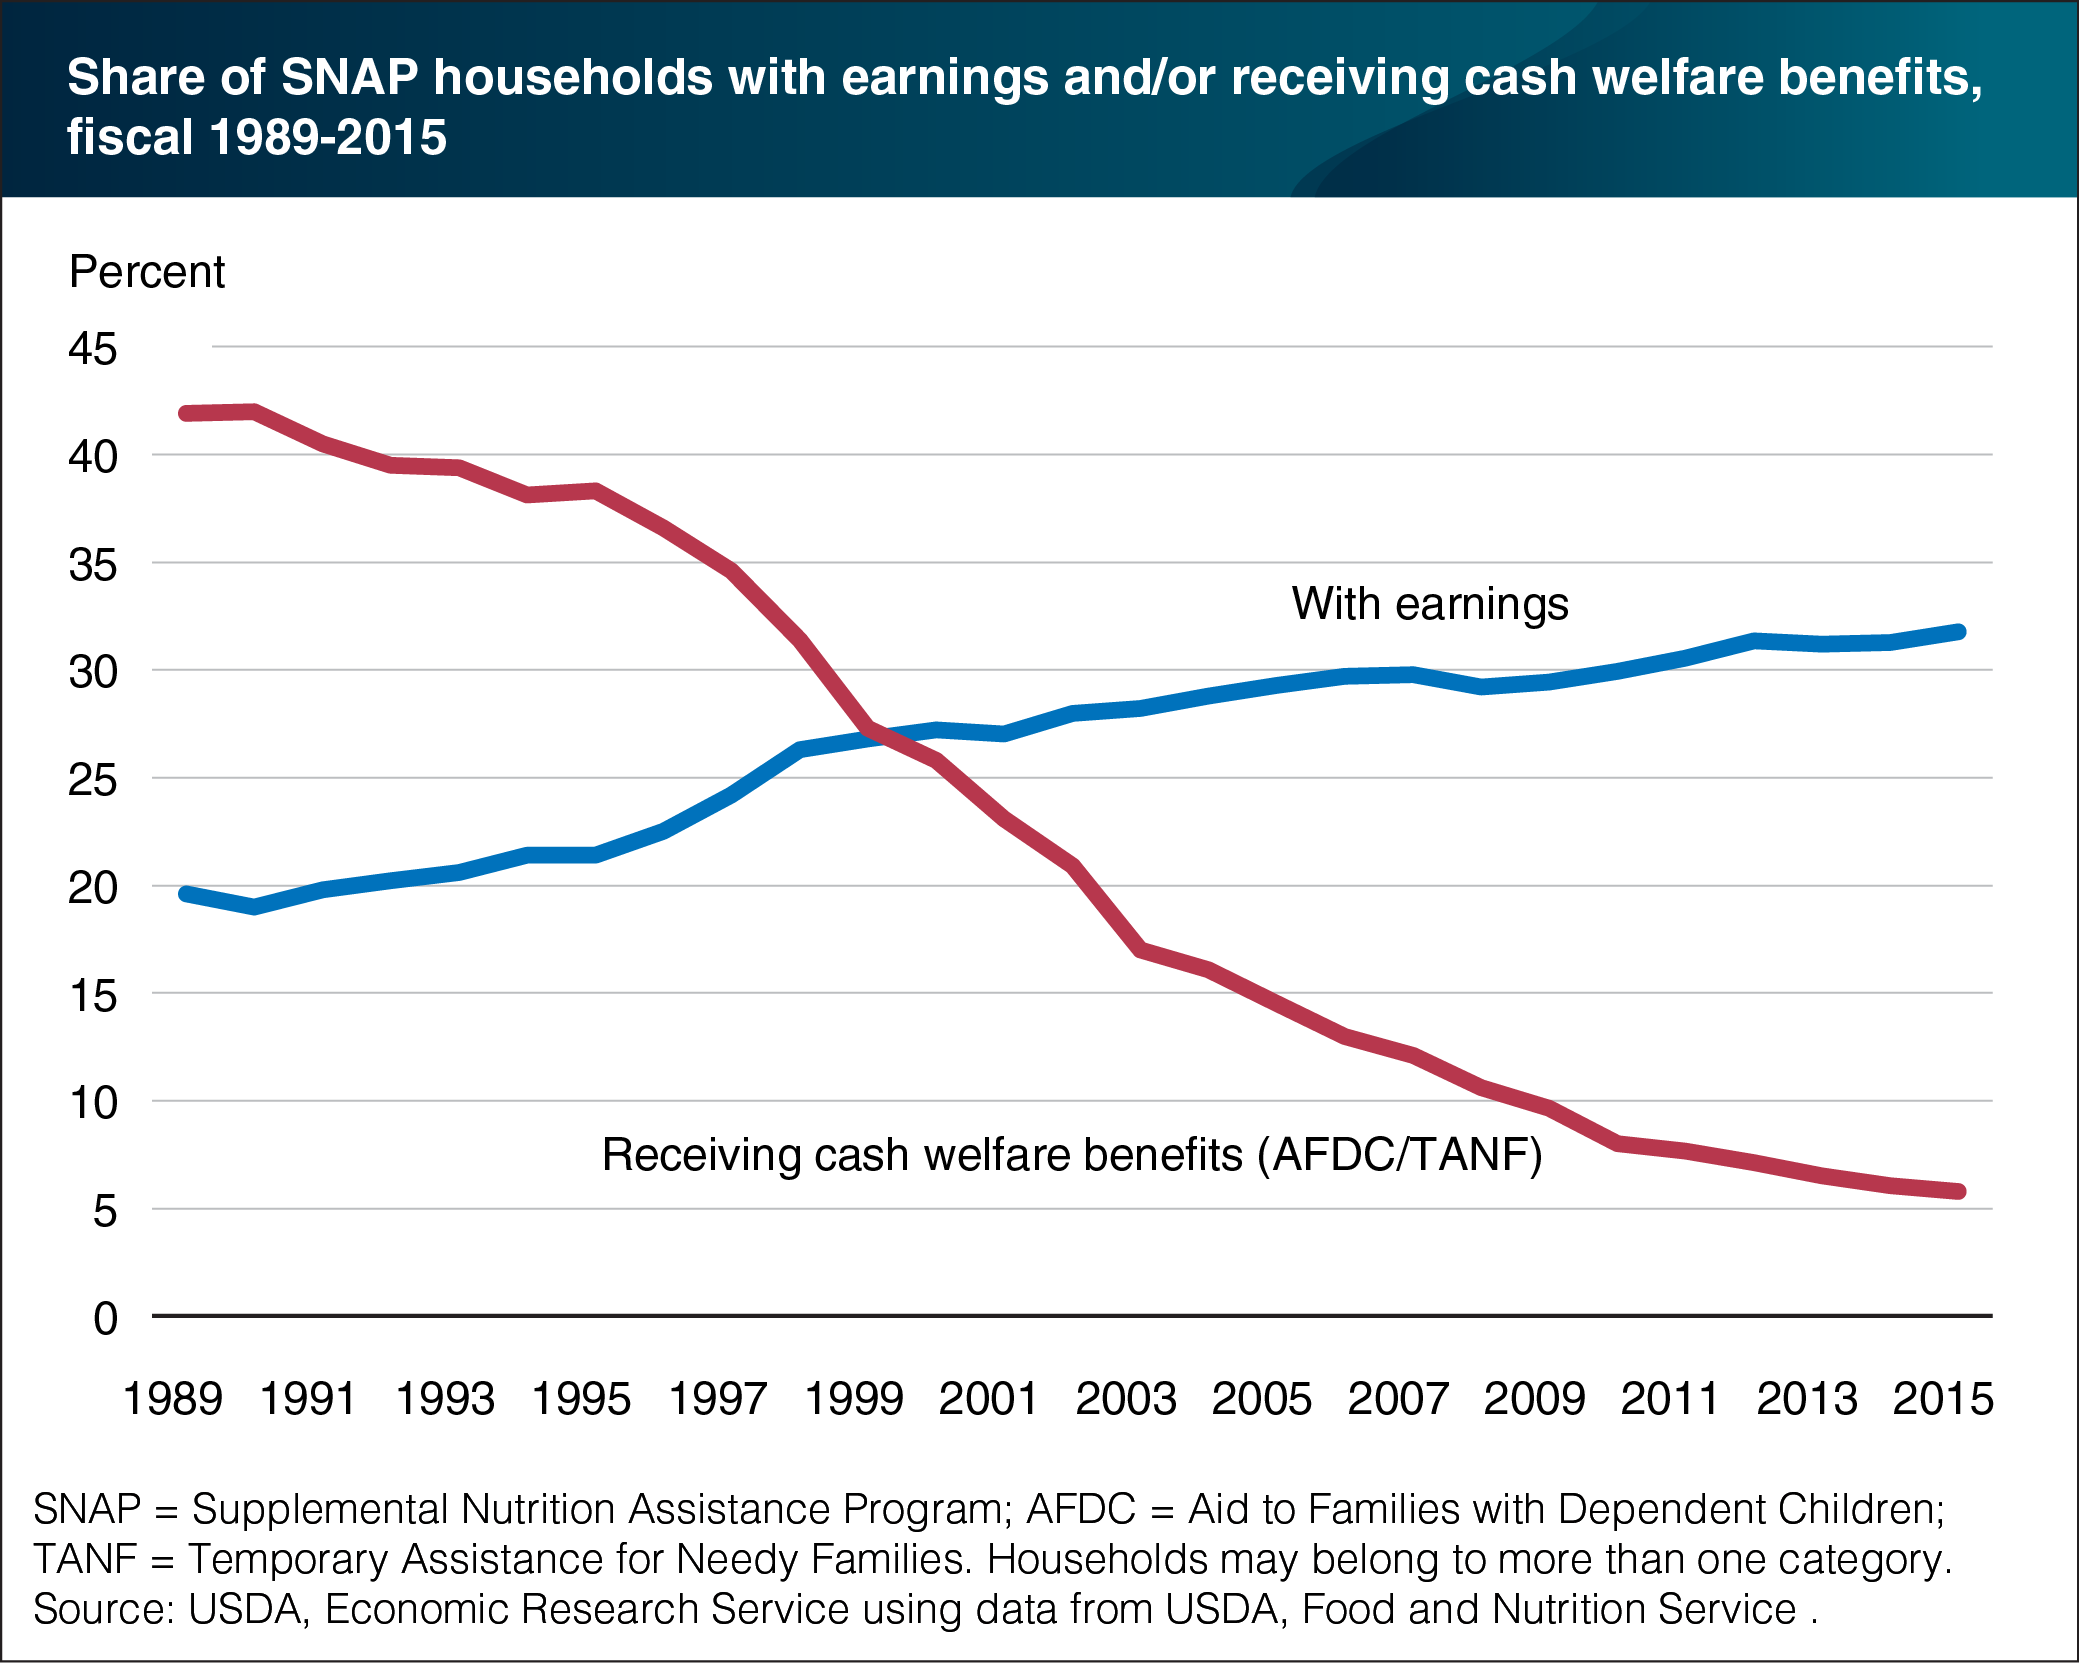
USDA’s Supplemental Nutrition Assistance Program (SNAP) serves a large and diverse population of low-income households. In a typical month in fiscal 2015, SNAP provided average monthly benefits of $127 per person to 45.8 million people living in 22.5 million households. Increasingly, SNAP is serving a larger share of households where one or more members are employed. Between fiscal 1989 and 2015, the share of SNAP households with earnings rose from 19.6 percent to 31.8 percent. In contrast, the percent of those receiving cash welfare (AFDC/TANF) declined from 41.9 percent to 5.8 percent over the same period. In fiscal 2015, 54.9 percent of households with children had some earned income, while 7.4 percent of households with elderly individuals and 10.7 percent of households with non-elderly individuals with disabilities had earnings. In fiscal 2015, 63.8 percent of SNAP households relied on income sources other than earnings and TANF benefits. These income sources include Supplemental Security Income (SSI), Social Security, unemployment insurance, General Assistance, child support, and/or pensions. SNAP households may also receive non-cash assistance such as housing and medical care. The data for this chart are from the Supplemental Nutrition Assistance Program (SNAP) topic page on the ERS Web site.
We’d welcome your feedback!
Would you be willing to answer a few quick questions about your experience?