

Million-dollar farms accounted for over half of production in 2015
- by Robert A. Hoppe
- 3/7/2017
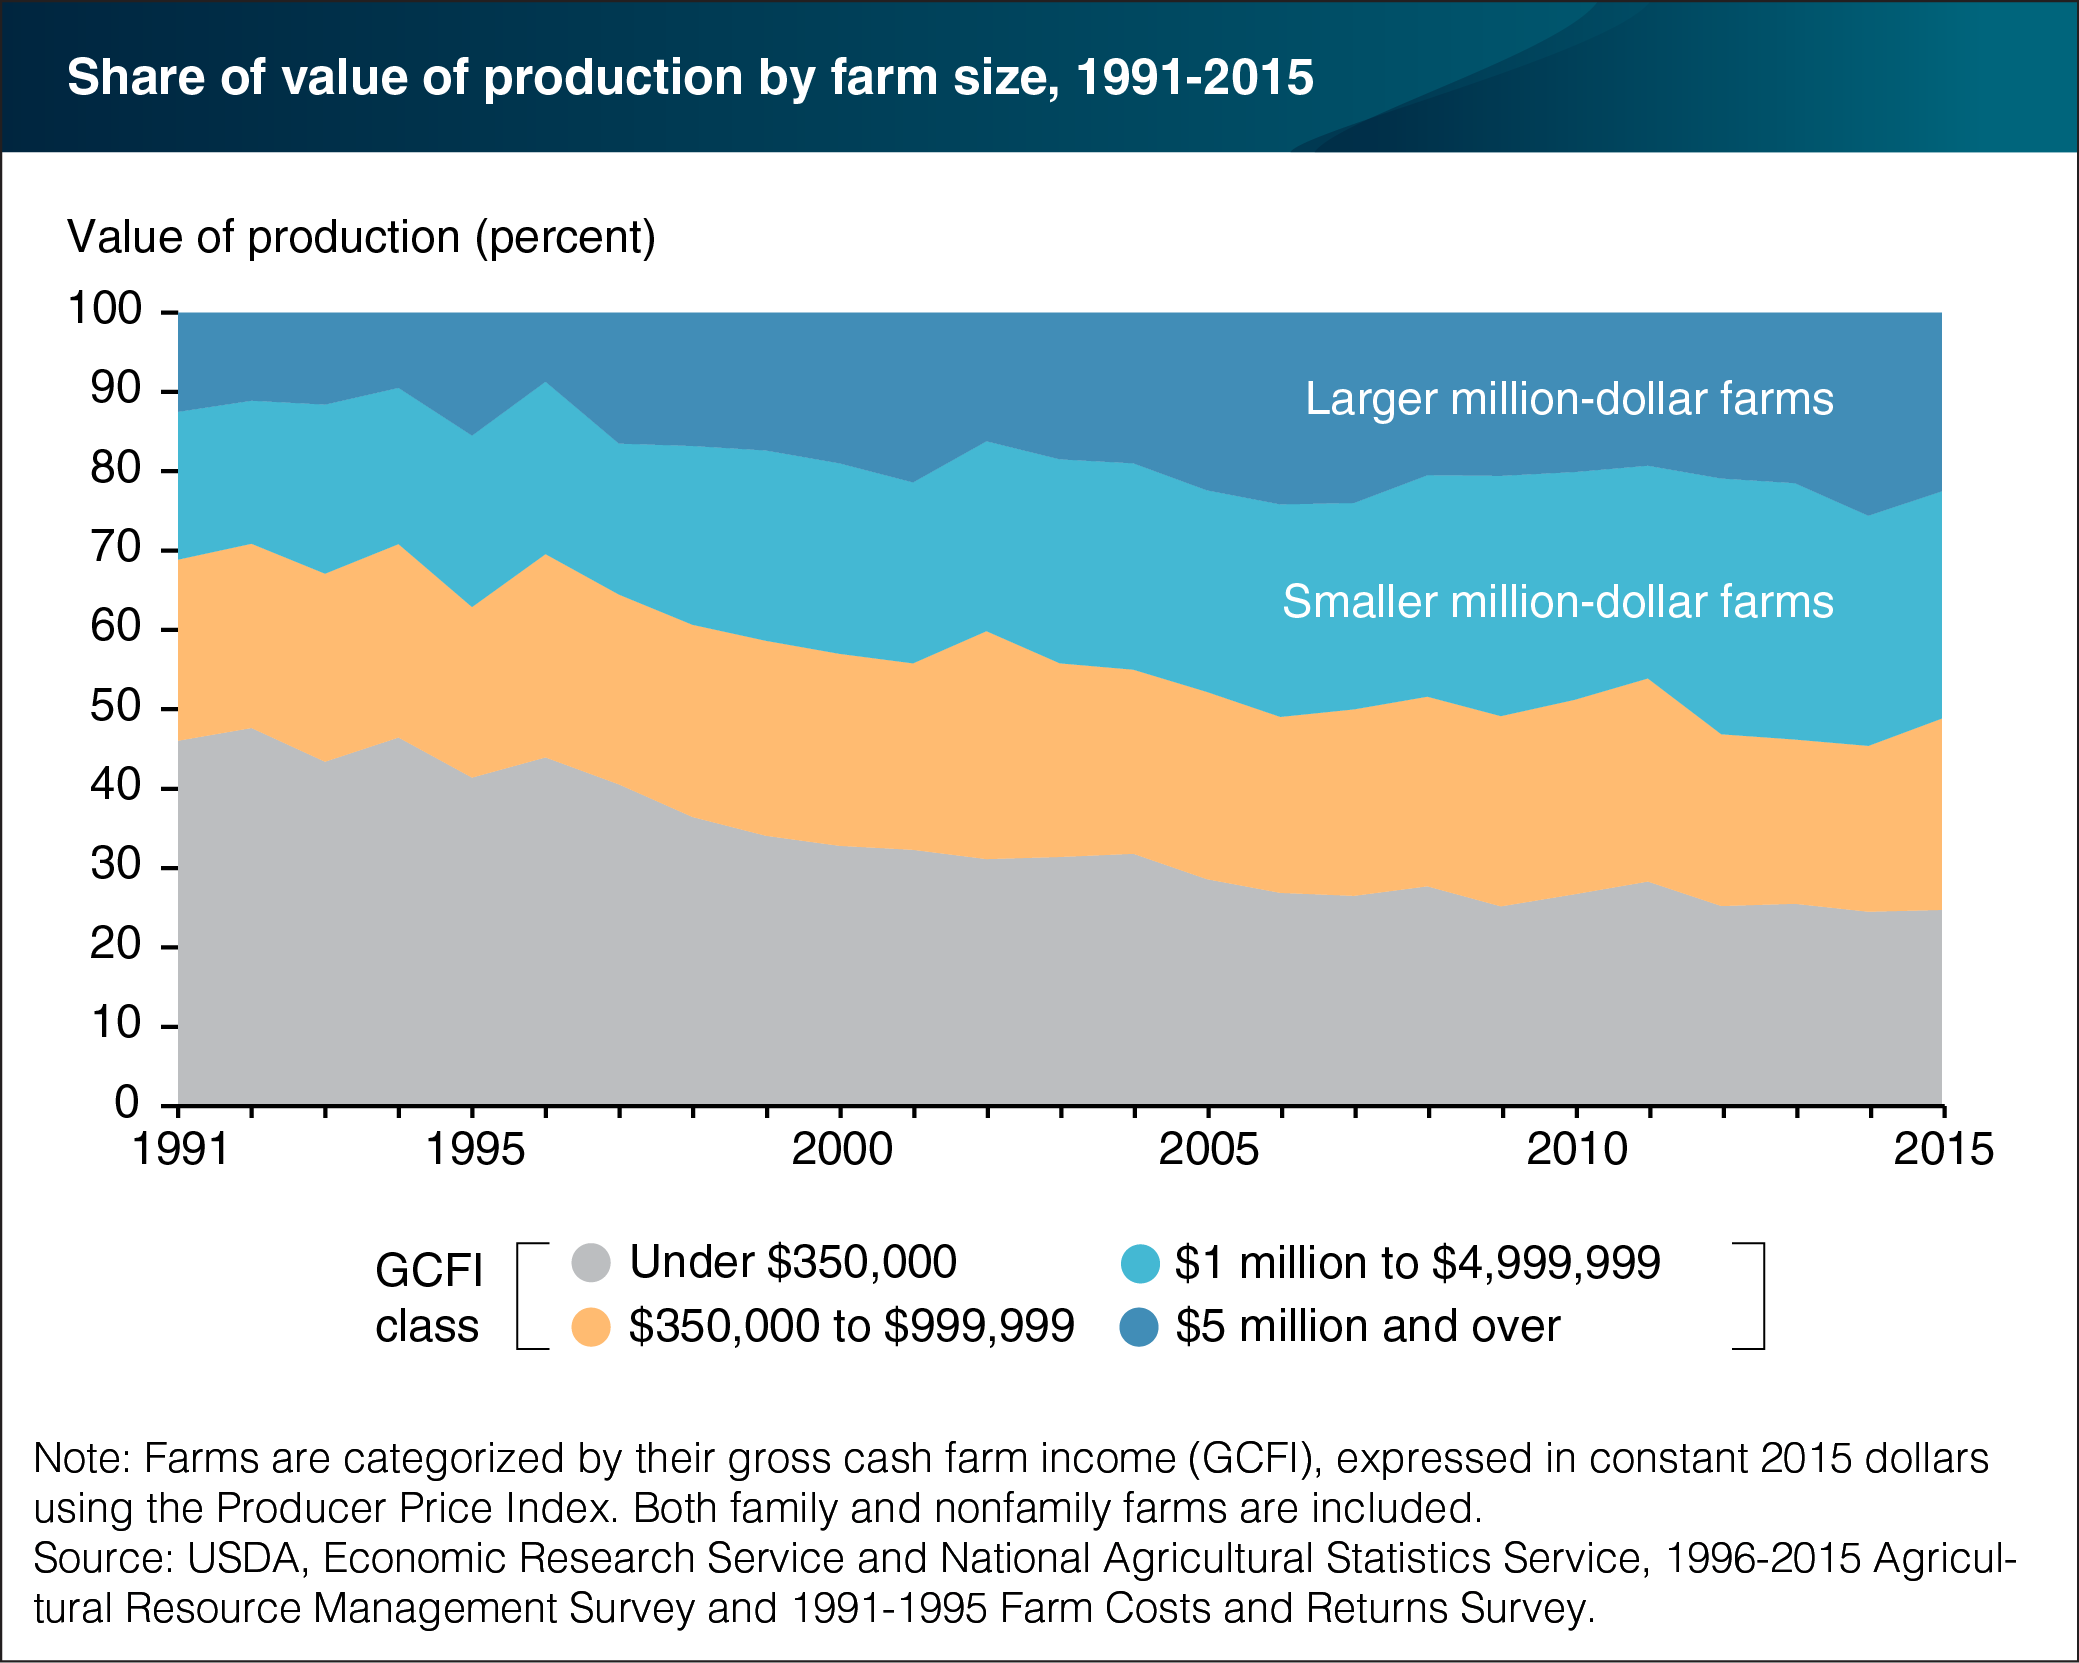
Agricultural production has been shifting to larger farms for many years. Farms with over $1 million in gross cash farm income (GCFI) accounted for half of the value of U.S. farm production in 2015, up from about a third in 1991. Most million-dollar farms (90 percent) are family farms; only 10 percent are nonfamily farms. Larger million-dollar farms (over $5 million in GCFI) nearly doubled their share of production between 1991 and 2015. Smaller million-dollar farms (GCFI between $1 million and $4,999,999) increased their share from 19 percent to 29 percent. This marks a shift in the share of production from small farms (GCFI under $350,000). Small farms accounted for 46 percent of production in 1991; by 2015, they accounted for less than 25 percent. Farmers who take advantage of ongoing innovations to expand their operations can reduce costs and raise profits because they can spread their investments over more acres. This chart appears in the ERS report America's Diverse Family Farms, 2016 Edition, released December 2016.