
Energy used by the U.S. food system declined with rising energy prices from 2002 to 2012
- by Patrick Canning
- 2/15/2017
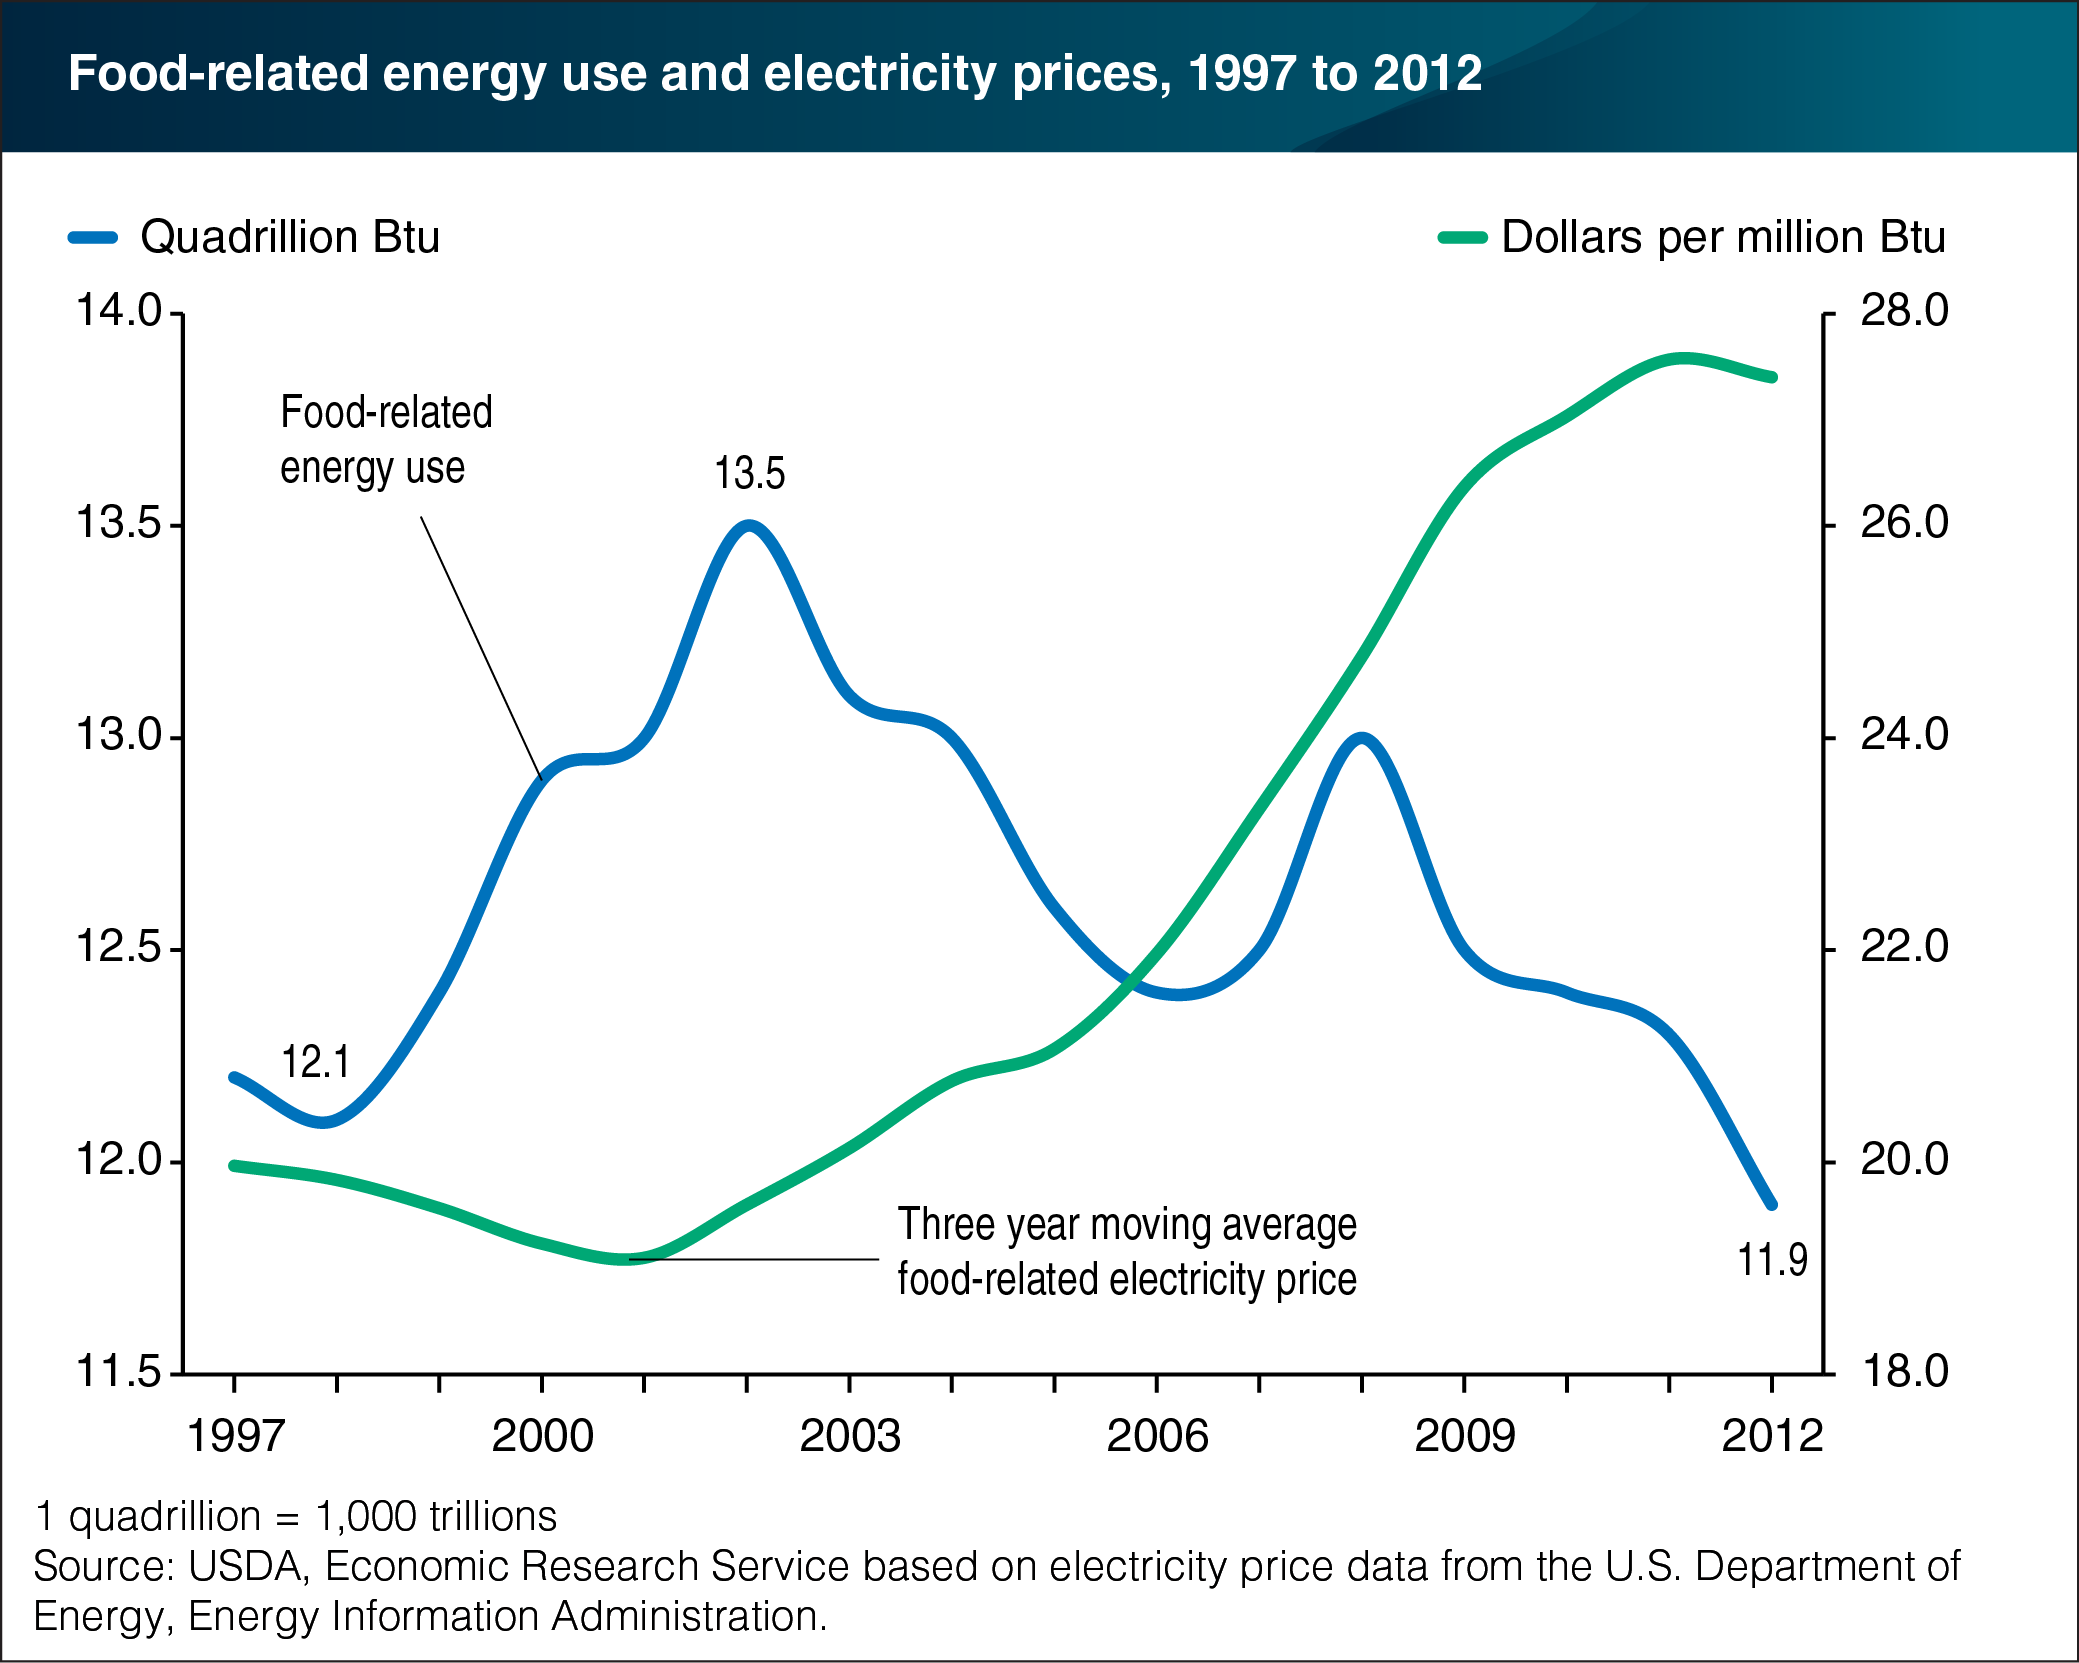
Energy used to produce and prepare the foods and beverages purchased by and for U.S. consumers reached 13.5 quadrillion British thermal units (Btu) in 2002. Electricity accounted for 59 percent of the energy used by the U.S. food system in 2002. In the years leading up to 2002, electricity prices paid by U.S. processing plants, grocery stores, restaurants, and other food system participants—including consumers for their kitchen appliances—were trending downward. As a result, between 1998 and 2002 the U.S. food system substantially increased its use of energy and accounted for over half of the increase in the Nation’s energy budget over this period. Between 2000 and 2010, the average price paid for electricity across the U.S. food system increased about 50 percent. Faced with this steep increase in electricity prices, food-related energy use declined over most of this period, falling to 11.9 quadrillion Btu in 2012. Food-related energy use accounted for 12.5 percent of the national energy budget that year. This chart is based on data reported in the ERS report, The Role of Fossil Fuels in the U.S. Food System and the American Diet, January 19, 2017.
We’d welcome your feedback!
Would you be willing to answer a few quick questions about your experience?