
Share of income spent on food by poorer U.S. households is relatively large and volatile
- by Charlotte Tuttle and Annemarie Kuhns
- 9/13/2016
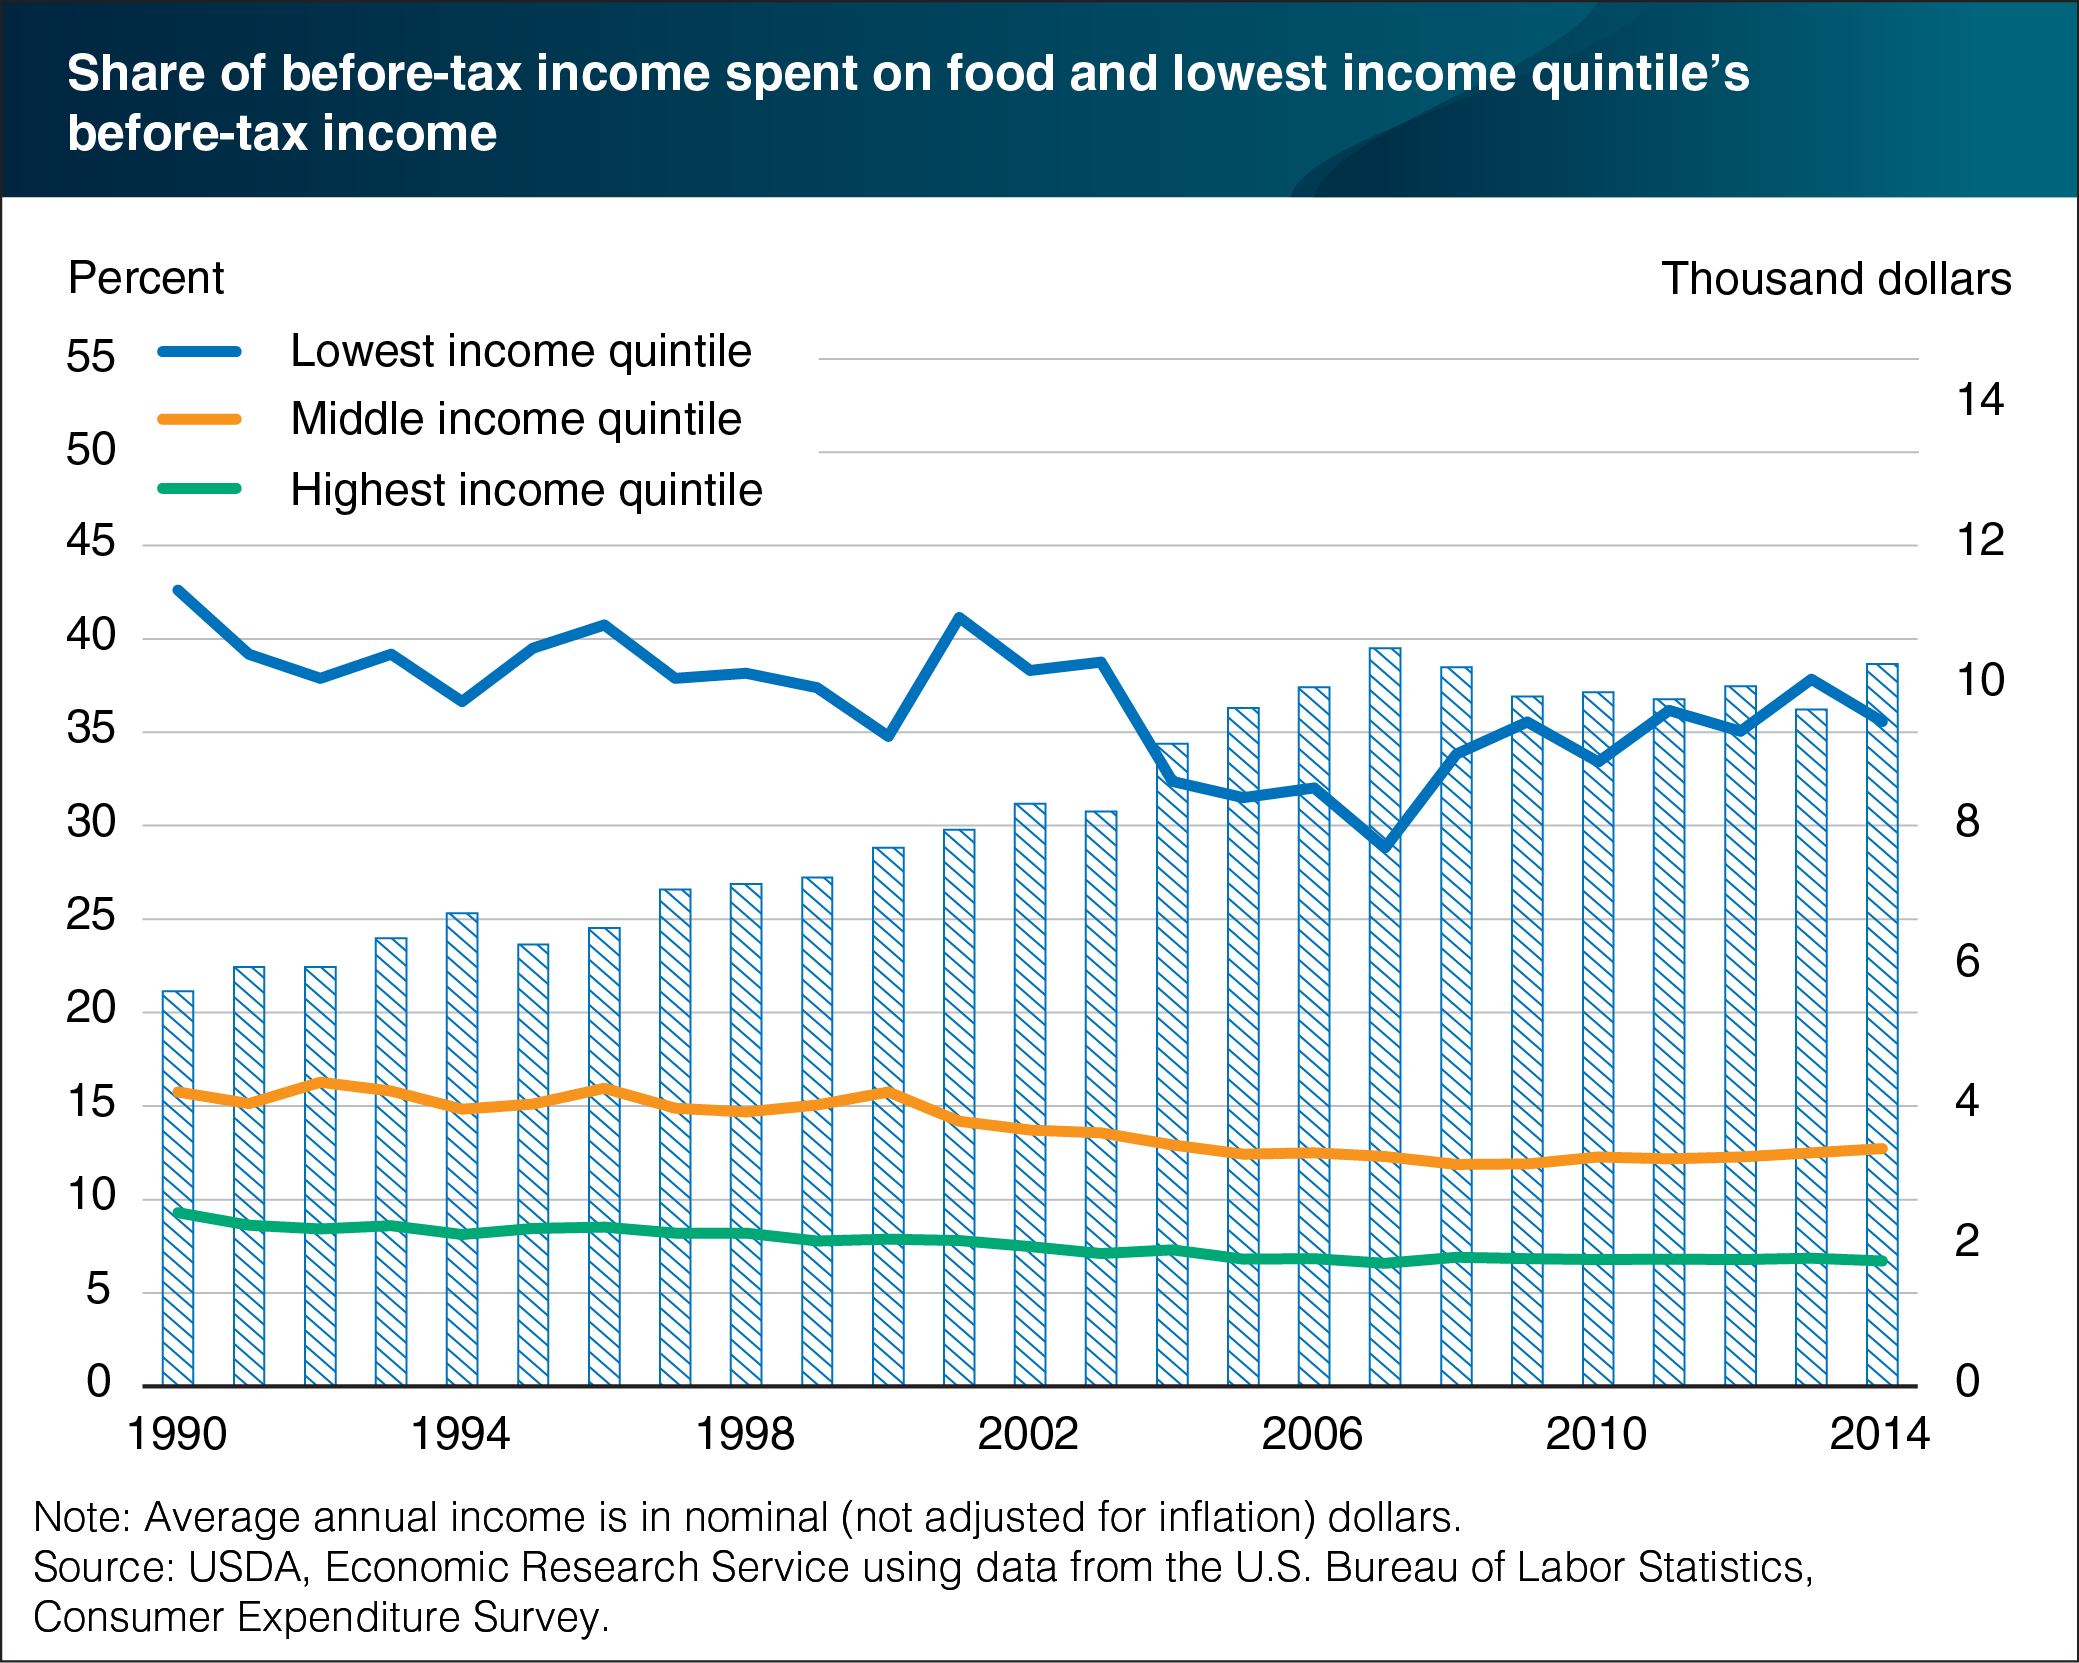
Over the past two and a half decades, U.S. households in the lowest income quintile (the poorest 20 percent of households) spent between 28.8 and 42.6 percent of their annual before-tax income on food, compared with 6.5 to 9.2 percent spent by households in the highest income quintile. Before-tax income includes earnings and other money income, public assistance, Supplemental Security Income payments, and Supplemental Nutrition Assistance Program (SNAP) benefits. The share of income spent on food is more volatile for poorer households reflecting their less stable incomes and changes in grocery store (food-at-home) prices. Higher at-home food prices disproportionately affect the spending behavior of low-income households and often require them to allocate a larger share of their incomes to food. The lowest income households saw their share of income spent on food drop from 41.1 to 28.8 percent over the years 2001 to 2007, rise to 35.5 percent in 2009, rise again to 37.8 percent in 2013, and return to 35.5 percent in 2014. Over the same period, the highest income households saw relatively minor yearly swings of 0.5 to 1.0 percentage points. This chart appears in “Percent of Income Spent on Food Falls as Income Rises” in the September 2016 issue of ERS’s Amber Waves magazine.