
Average share of income spent on total food in the United States has remained relatively constant since 2000
- by Economic Research Service
- 8/25/2016
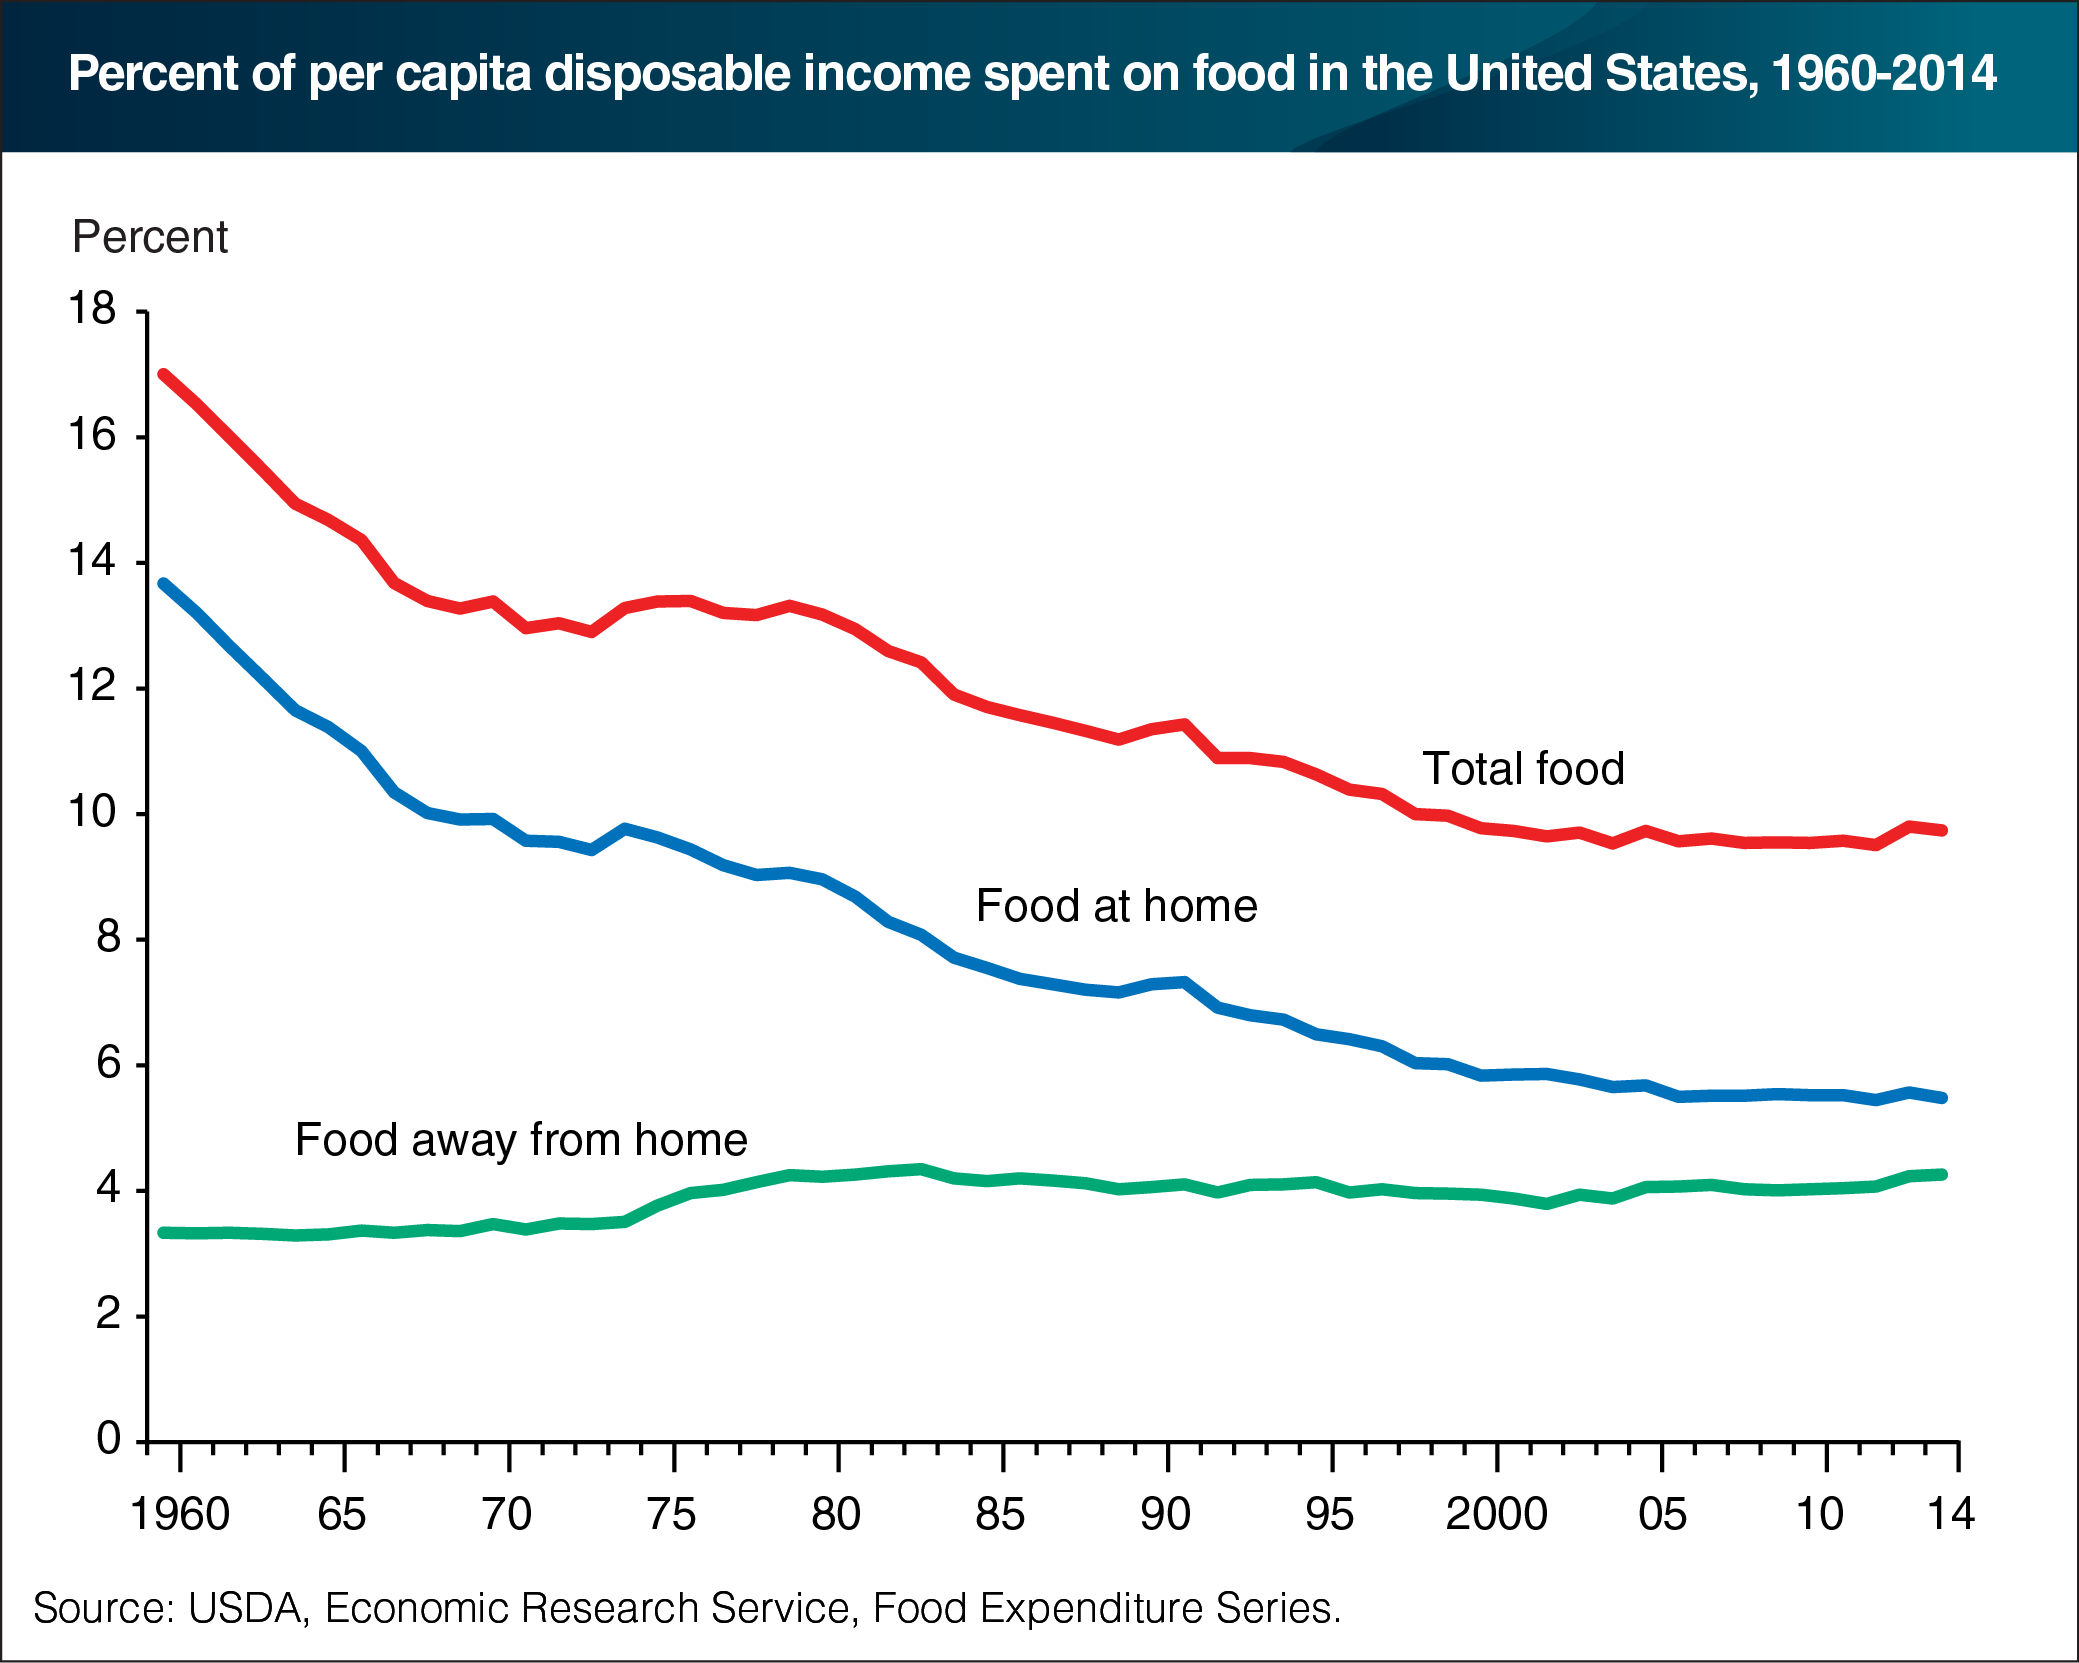
In 2014, Americans spent an average of 9.7 percent of their disposable personal incomes (DPI) on food. After falling from 17.0 percent in 1960 to 10.0 percent in 1999, the share of DPI spent on total food by the average American has remained between 9.5 and 9.8 percent since 2000. The share of DPI spent on food away from home (food purchased from restaurants, fast food places, schools, and other food-away-from-home eating places) was 3.9 percent in 2000, 4.1 percent in 2005 and, after flattening out during the 2007-09 recession through 2012, reached 4.3 percent in 2014. In contrast, the share of DPI spent on food at home (food purchased from supermarkets, convenience stores, warehouse club stores, supercenters, and other retailers) declined from 5.8 percent in 2000 to 5.5 percent in 2014. This chart appears in the ERS data product, Ag and Food Statistics: Charting the Essentials. More information on U.S. food sales and expenditures can be found in ERS’s Food Expenditures data product.