
Two demographic trends contribute to the concentration of older populations in some rural counties
- by John Cromartie
- 8/24/2016
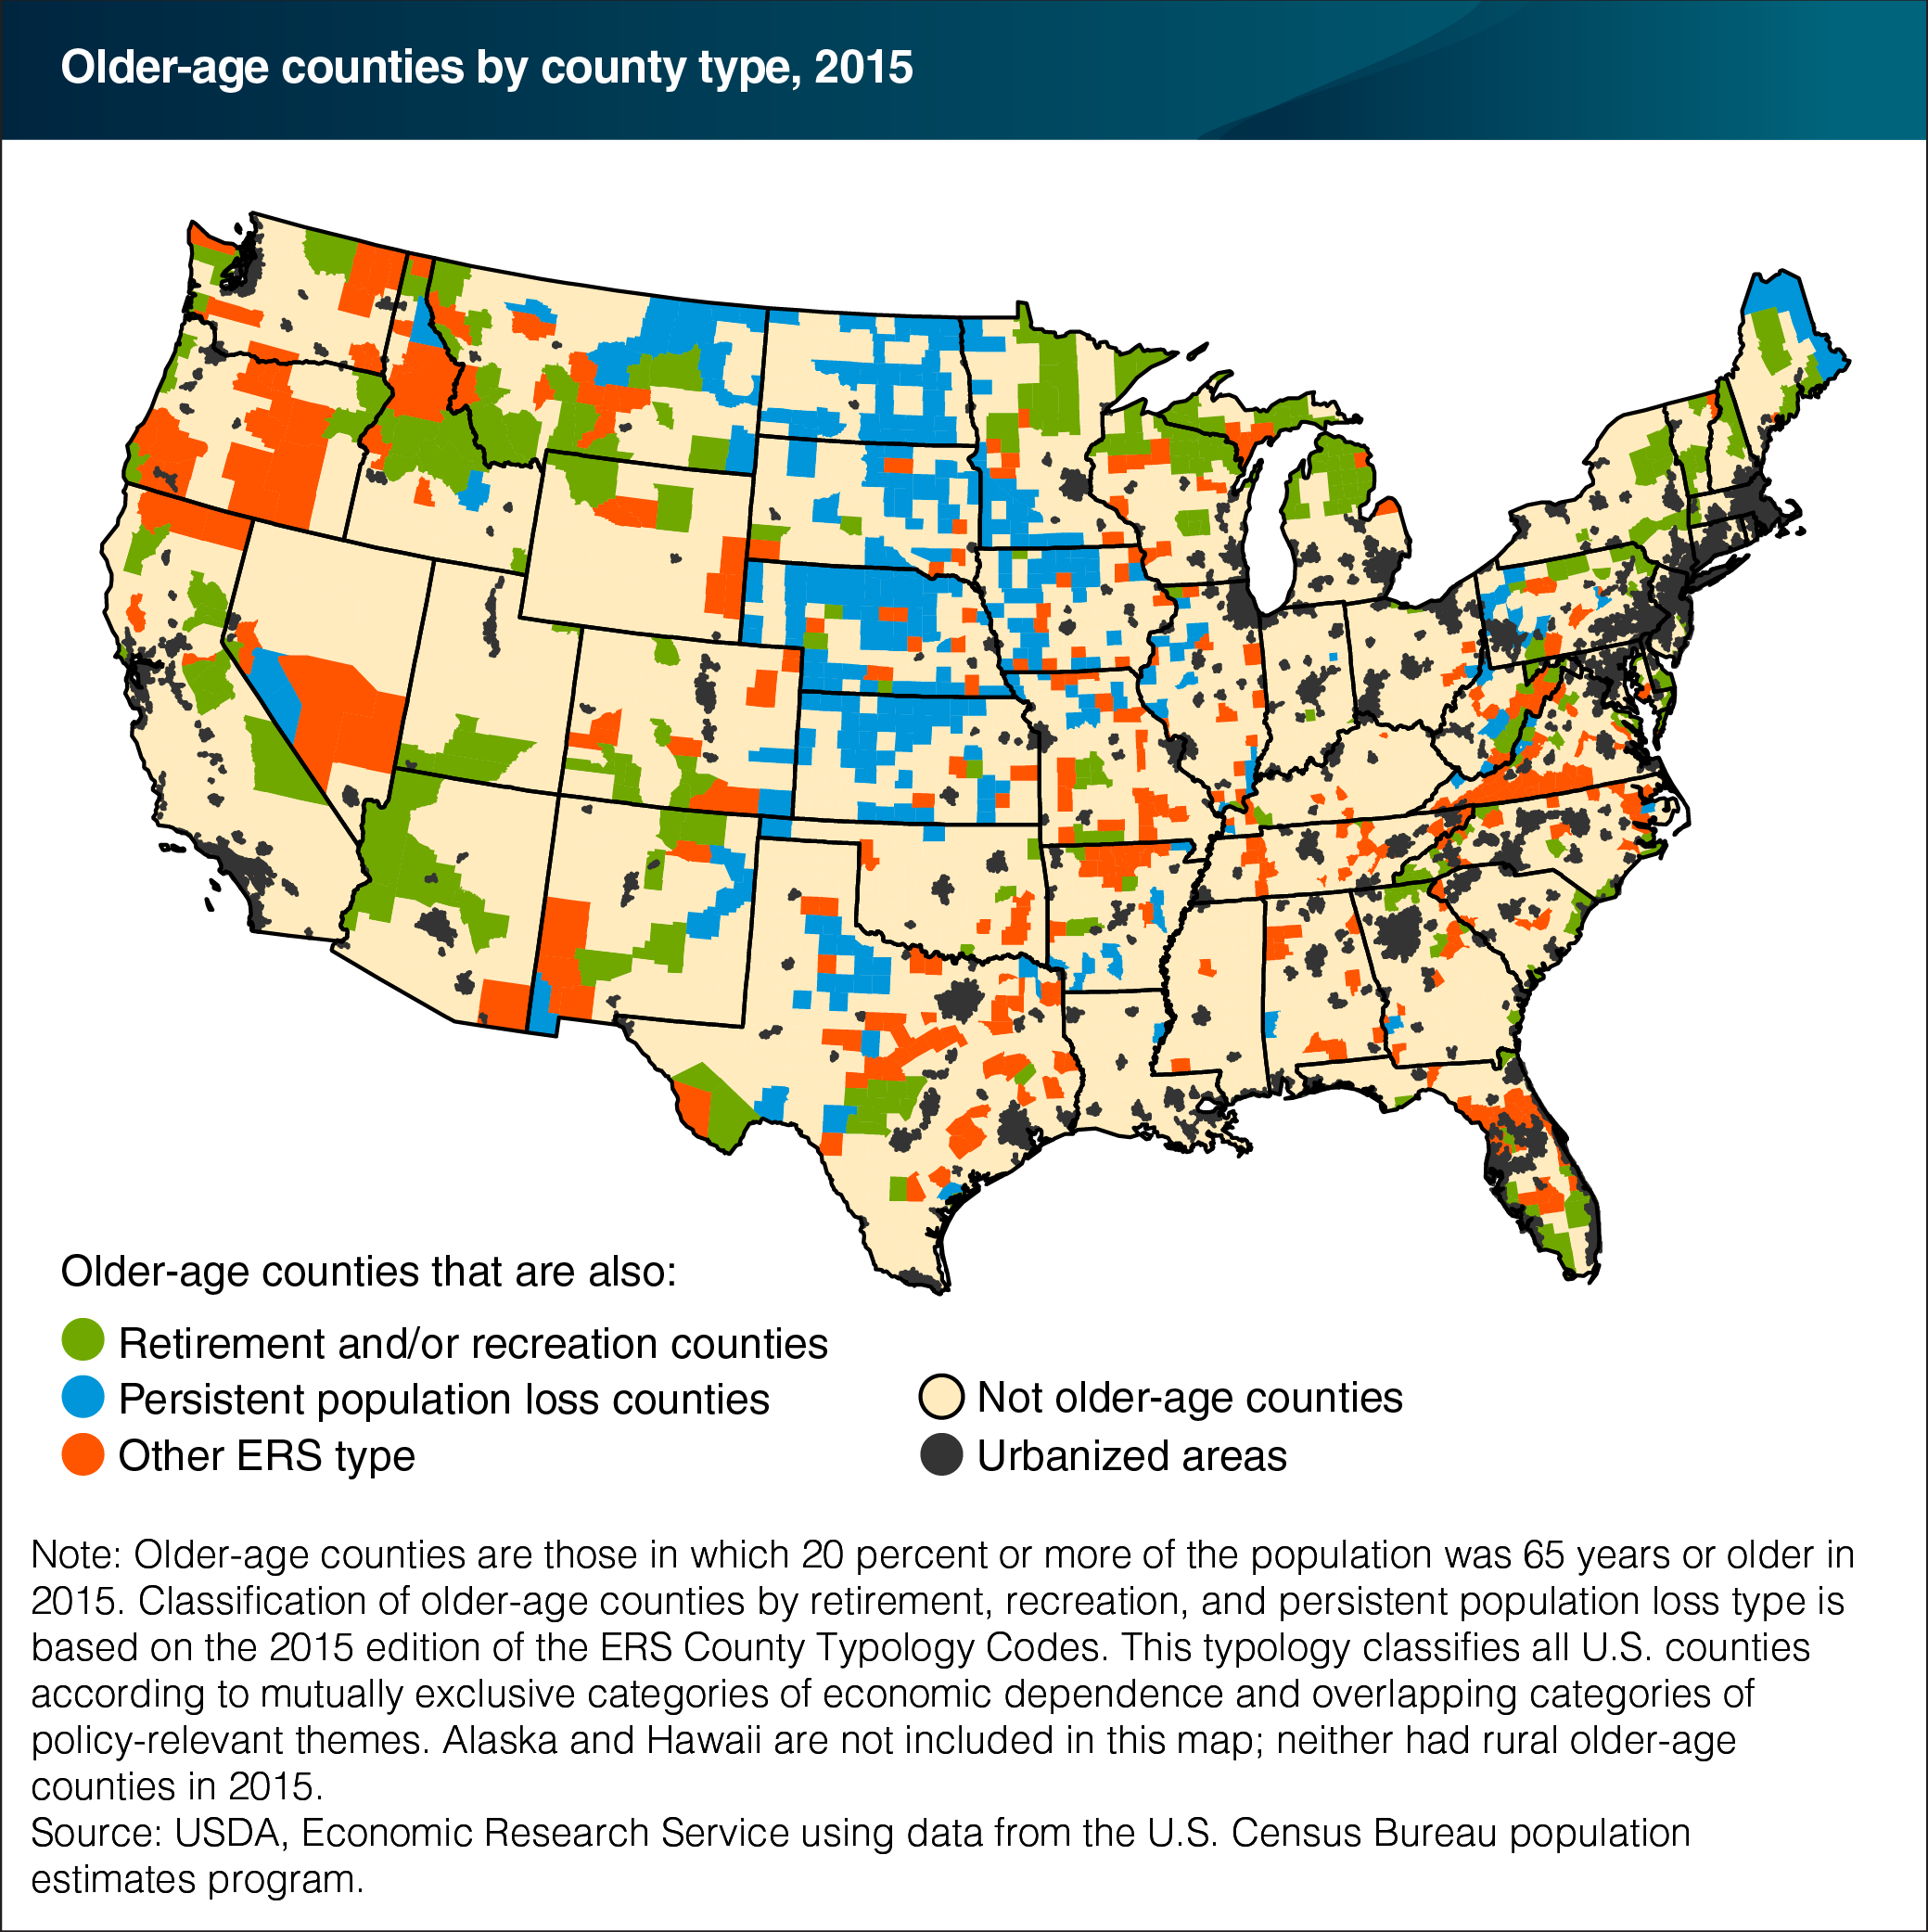
For nearly 4 out of 10 rural counties in the U.S., 20 percent or more of the population was 65 years or older in 2015, compared with about 1 in 10 urban counties. Two long-term demographic trends help explain the concentration of older population in some of these rural “older-age” counties. First, retirees and near-retirees tend to migrate to more scenic destinations; about a third of older-age rural counties are classified by ERS as being retirement destinations, having recreation-based economies, or both. Second, young-adults tend to migrate away from more remote and less scenic rural counties, while older residents stay; another third of older-age rural counties are classified as persistent population loss counties. Many of the remaining third of older-age counties combine retiree attraction with young-adult out-migration, such as in the Ozarks in northern Arkansas or along the Virginia-North Carolina border. While these two trends create similar county age profiles, population growth and population decline generate different challenges for the communities involved. This map is based on data found in the Atlas of Rural and Small Town America.