
Energy-based expenses vary across farm businesses
- by Claudia Hitaj
- 8/15/2016
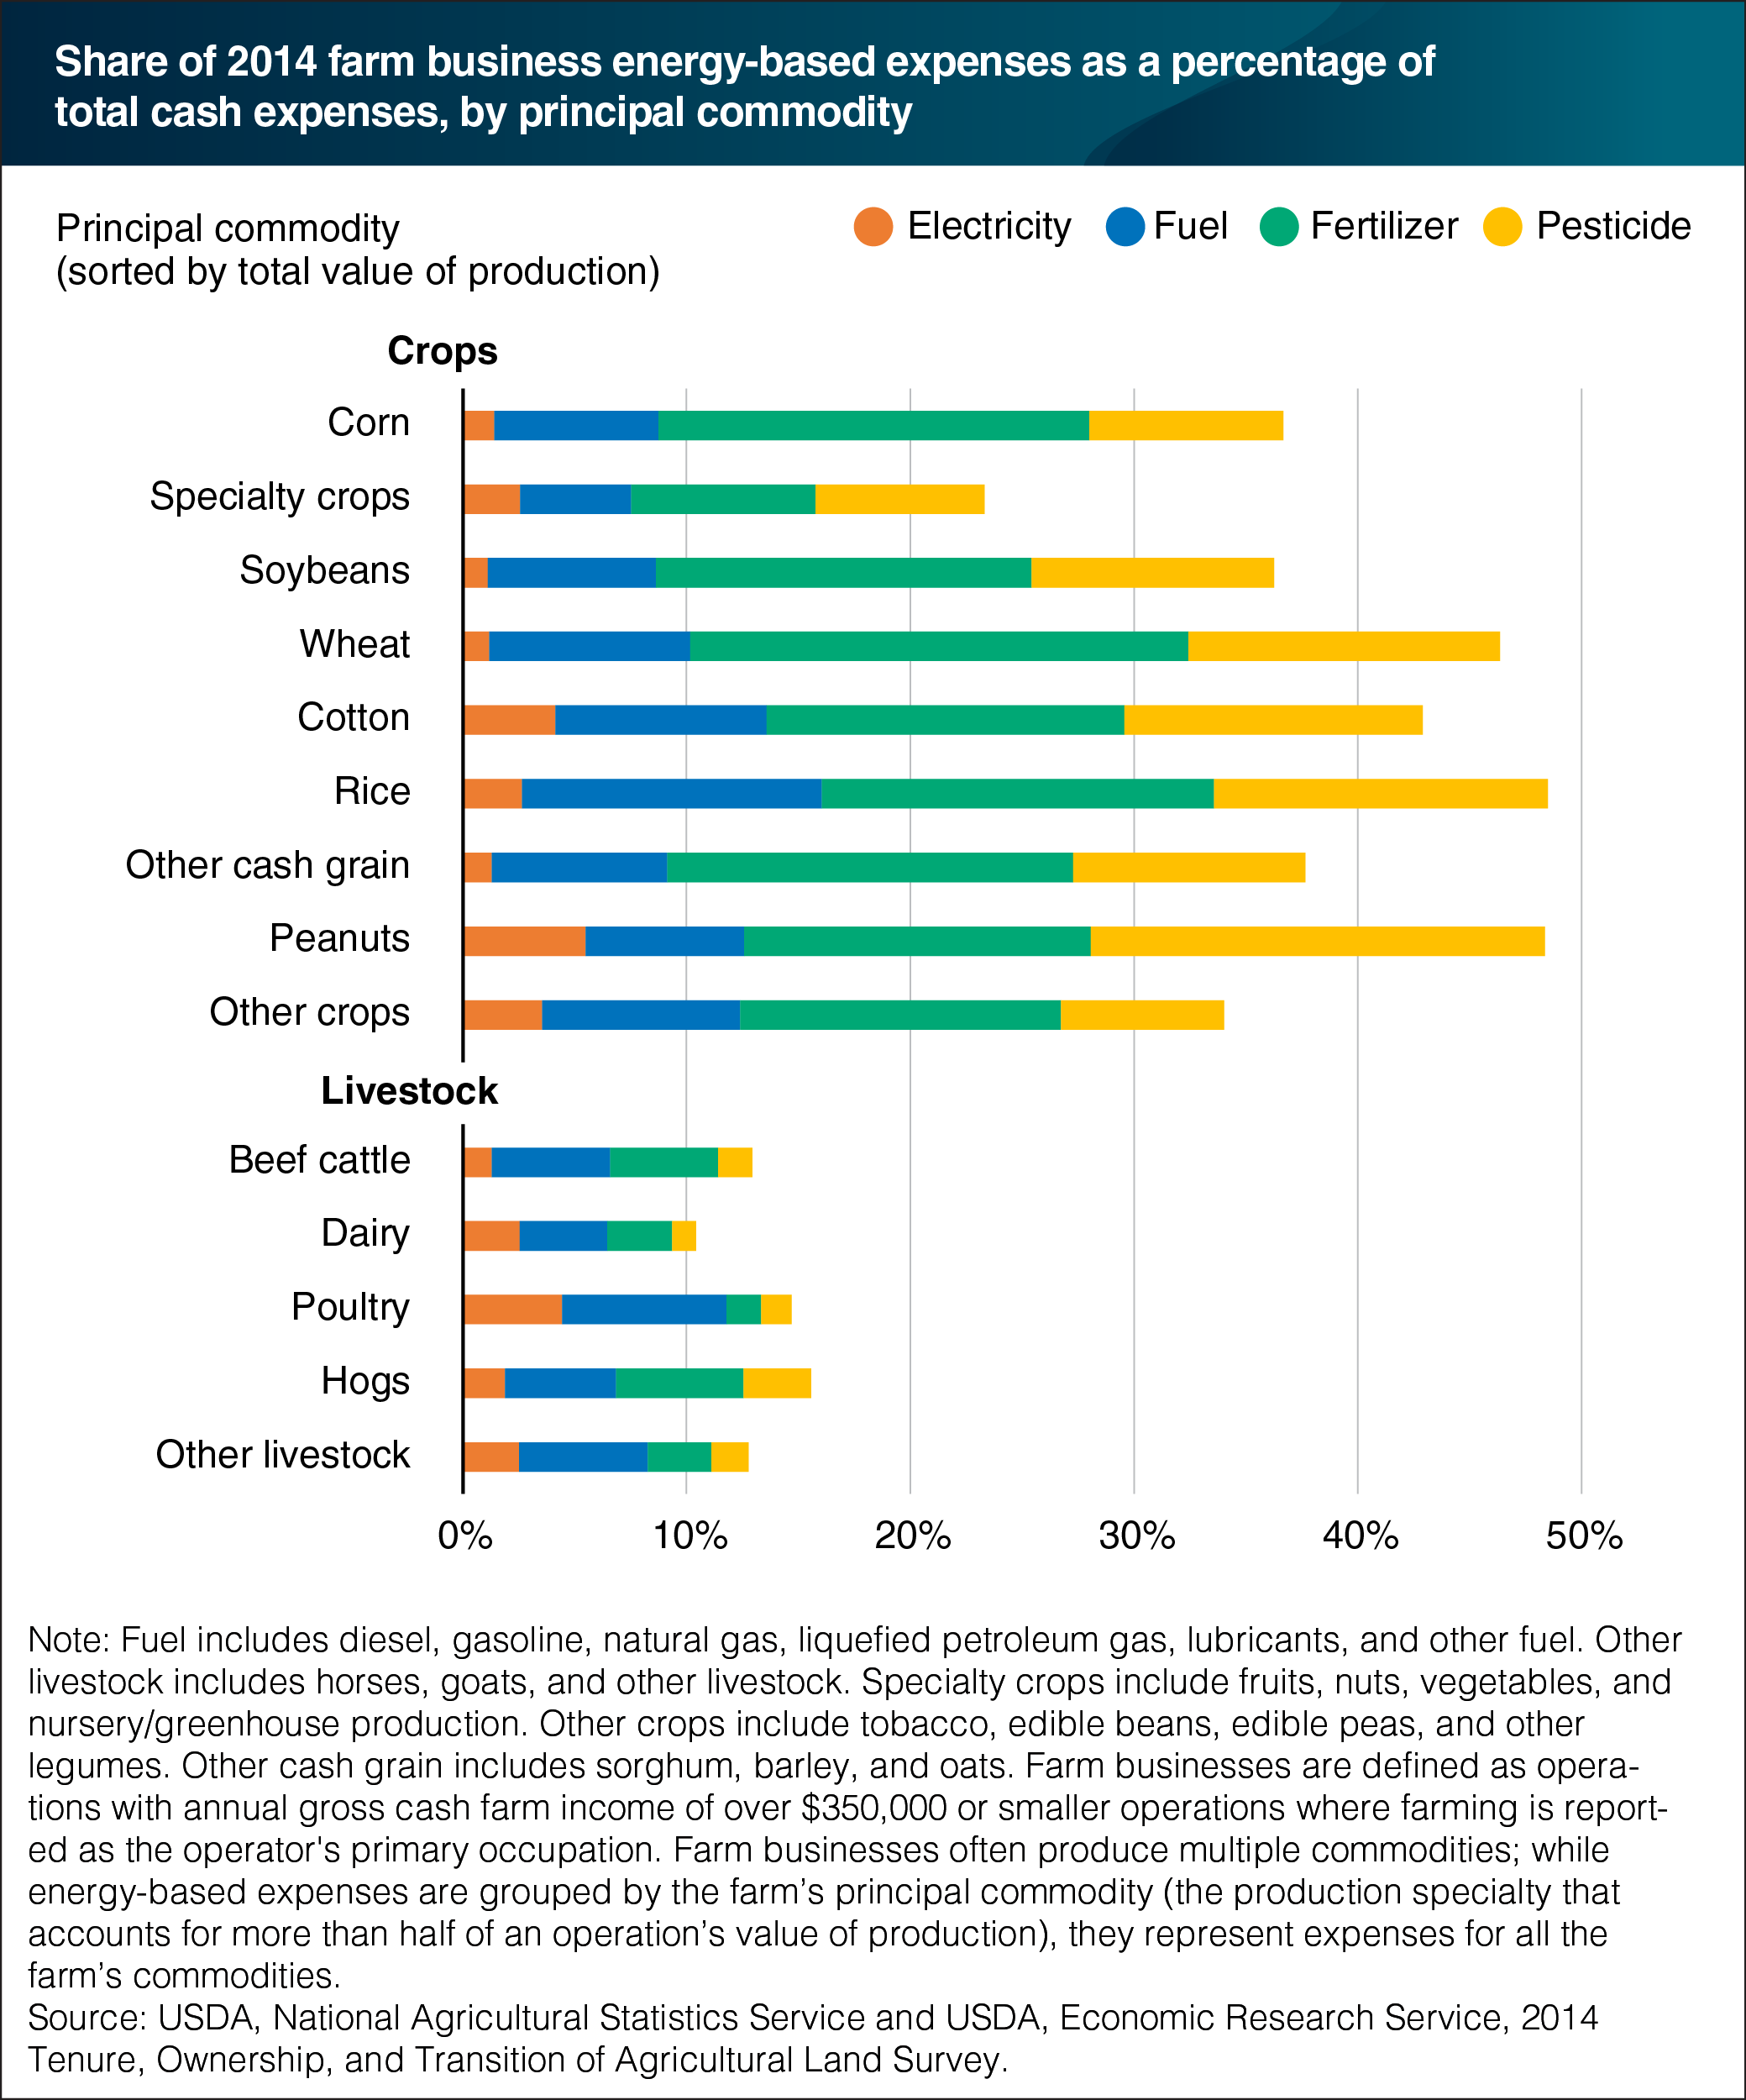
Farms consume energy directly in the form of gasoline, diesel, electricity, and natural gas; and indirectly in energy-intensive inputs such as fertilizer and pesticides. Farm businesses—operations with annual gross cash farm income of over $350,000 or smaller operations where farming is reported as the operator’s primary occupation—vary in mix and intensity of direct and indirect energy use. In 2014, farm businesses concentrating on rice, peanut, wheat, and cotton production spent 43-49 percent of their total cash expenses on direct and indirect energy inputs, more than any other crop and livestock producers. Fertilizer and pesticides, which are indirect energy uses because they require large amounts of energy to manufacture, account for the greatest share of energy expenses among farm businesses primarily producing crops. For livestock producers, feed is also an important indirect energy expense but, in this analysis, these costs are accounted for in the crop budgets. Fertilizer expenses accounted for 18-22 percent of total cash expenses for farm businesses concentrating in wheat, corn, and other cash-grain production, and 14-17 percent for farm businesses primarily producing other field crops. Cotton and rice production were associated with relatively high shares of direct energy inputs: fuel is used to apply chemicals and electricity powers irrigation equipment. Peanut producers, which use electricity for irrigation and on-farm drying of harvested peanuts, had the highest share of electricity use at 6 percent, followed by farm businesses concentrating on poultry and cotton at 4 percent. This chart is found in the ERS report, Trends in U.S. Agriculture’s Consumption and Production of Energy: Renewable Power, Shale Energy, and Cellulosic Biomass, released on August 11, 2016.