Supermarket shrink varies by type of fresh fruit and vegetable
- by Jean C. Buzby and Jeanine Bentley
- 6/23/2016

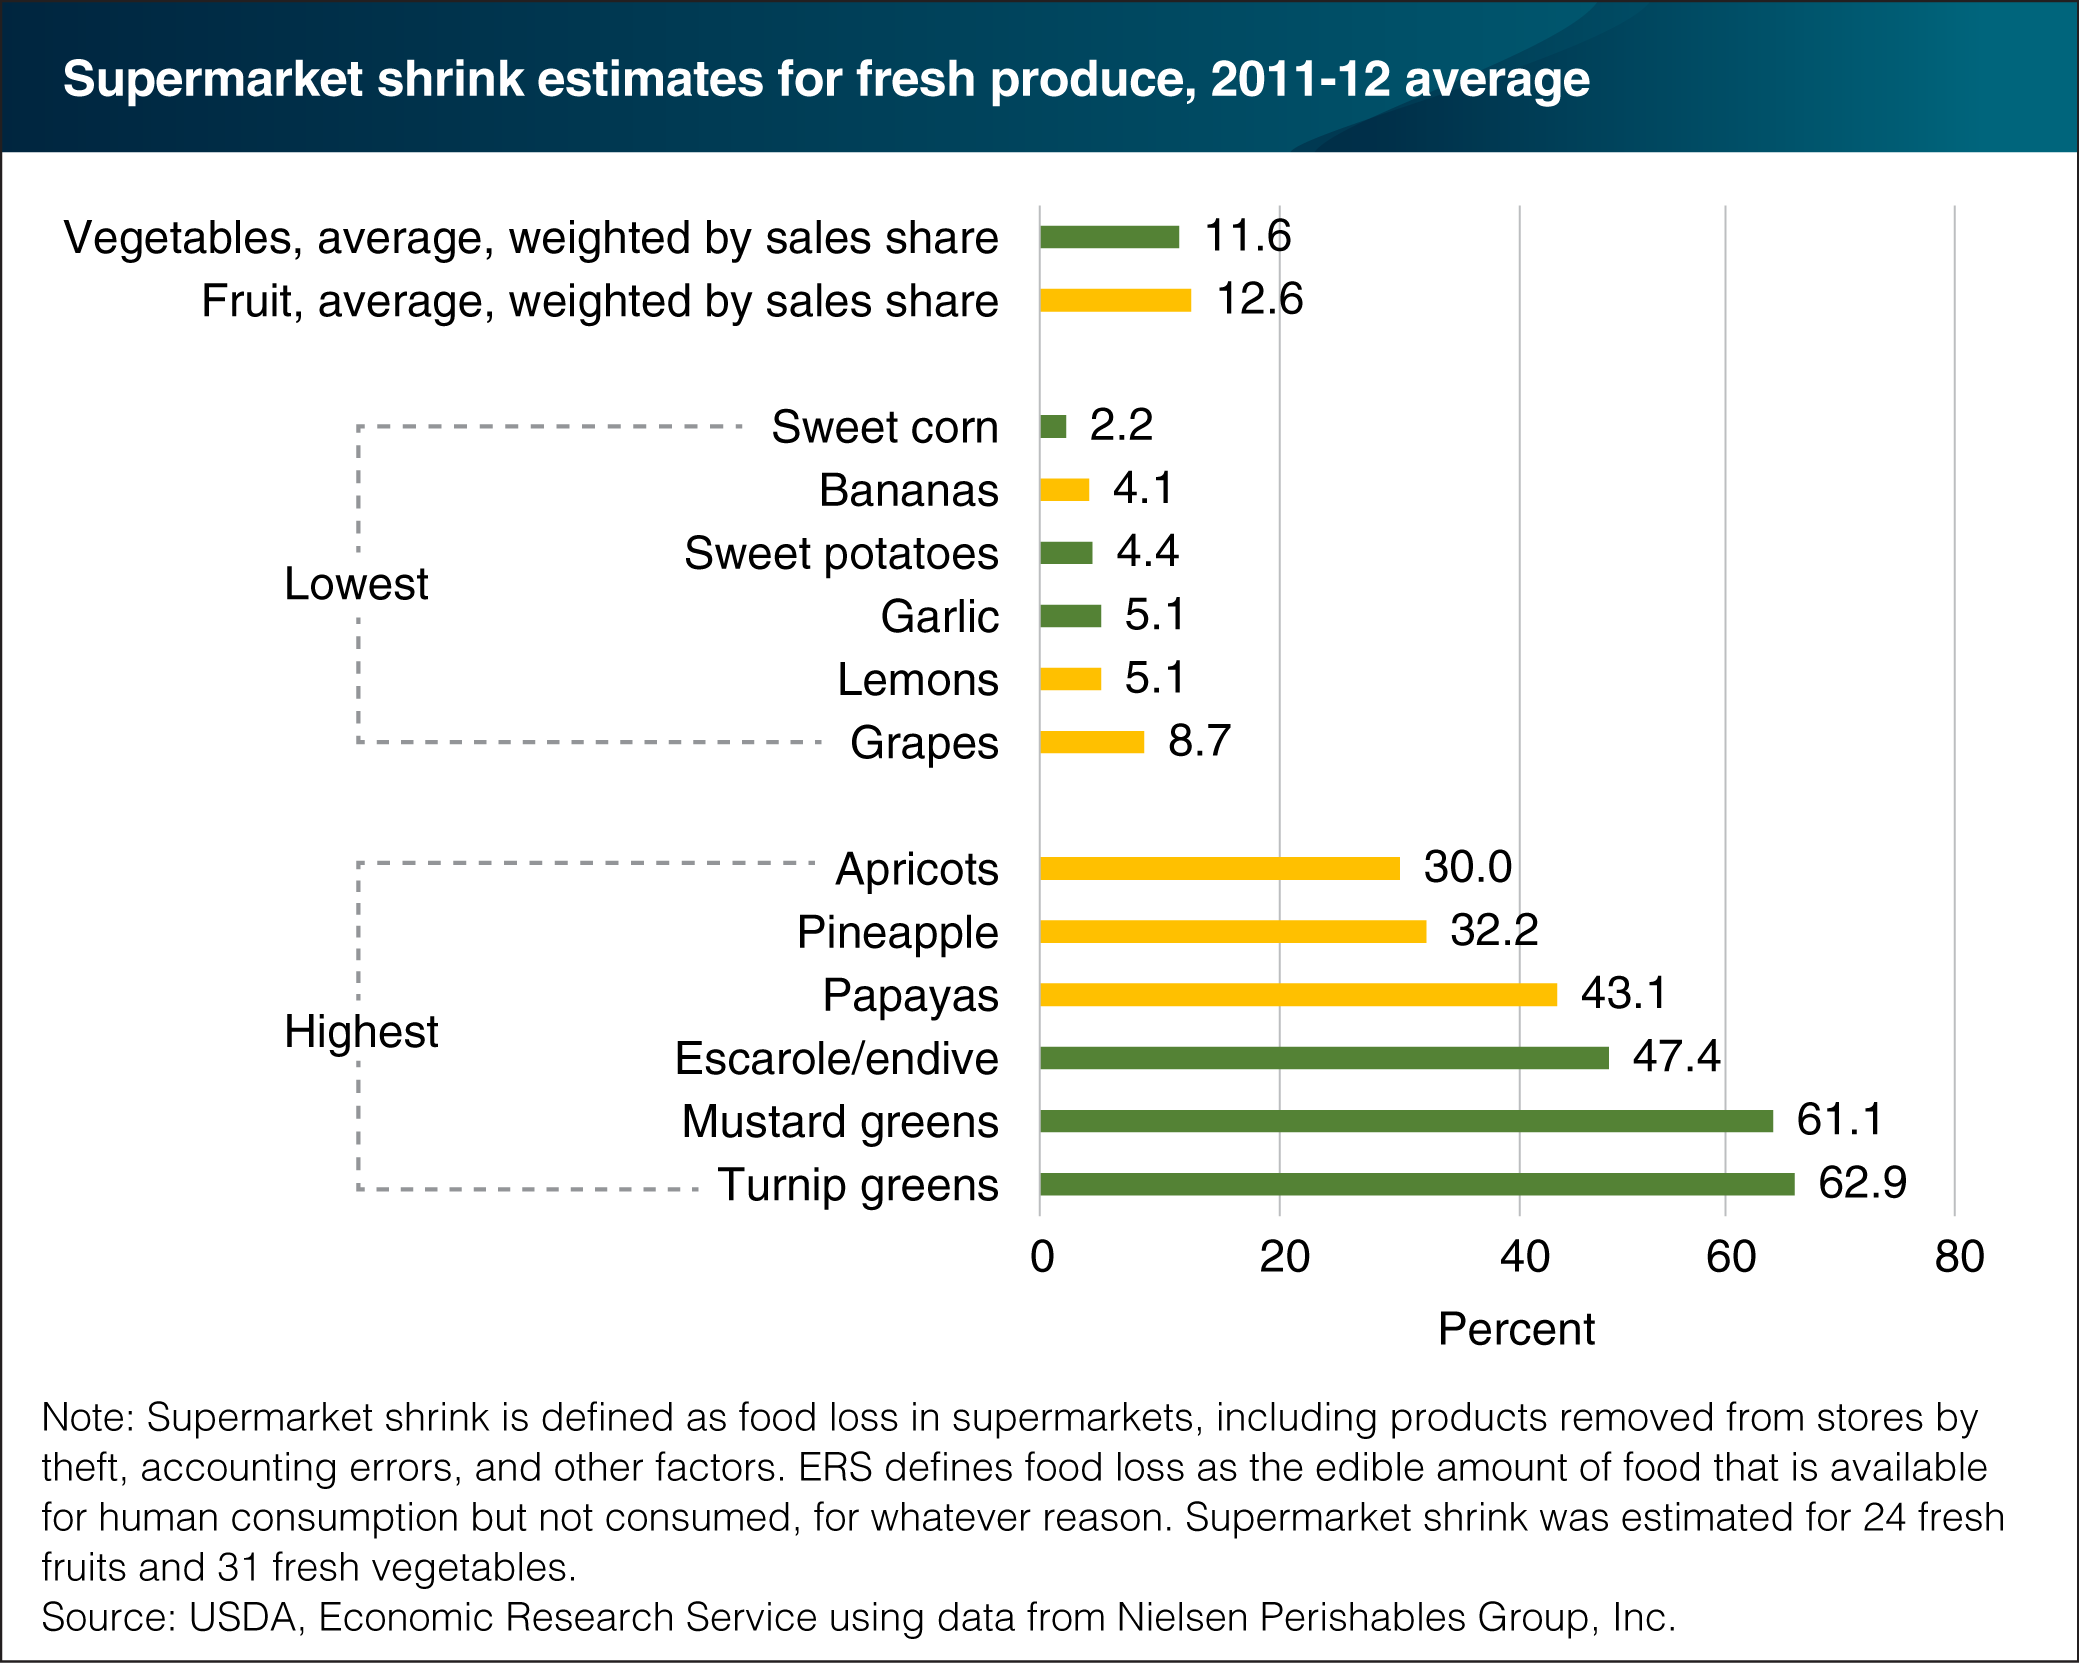
Food loss, or shrink as retailers call it, occurs when grocery retailers remove dented cans, misshaped produce items, overstocked holiday foods, and spoiled foods from their shelves. Estimates of supermarket shrink for fresh produce were developed by comparing data on pounds of shipments received with pounds purchased by consumers for 2,900 U.S. supermarkets in 2011-12. Average supermarket shrink was 12.6 percent for 24 fresh fruits and 11.6 percent for 31 fresh vegetables. For the fresh fruits, loss ranged from 4.1 percent for bananas to 43.1 percent for papayas. Pineapples and apricots had the second- and third-highest shrink rates for fresh fruits. The highest shrink in 2011-12 among the fresh vegetables was for turnip greens, followed by mustard greens, and escarole/endive. Leafy greens are more prone to moisture loss, and hence weight loss, than other types of produce. Uncertain or uneven demand for highly perishable produce items may also contribute to higher loss rates. The statistics in this chart are from the ERS report, Updated Supermarket Shrink Estimates for Fresh Foods and Their Implications for ERS Loss-Adjusted Food Availability Data, released on June 21, 2016.

