
Racial/ethnic diversity in rural America is increasing
- by Lorin Kusmin and Timothy Parker
- 6/7/2016
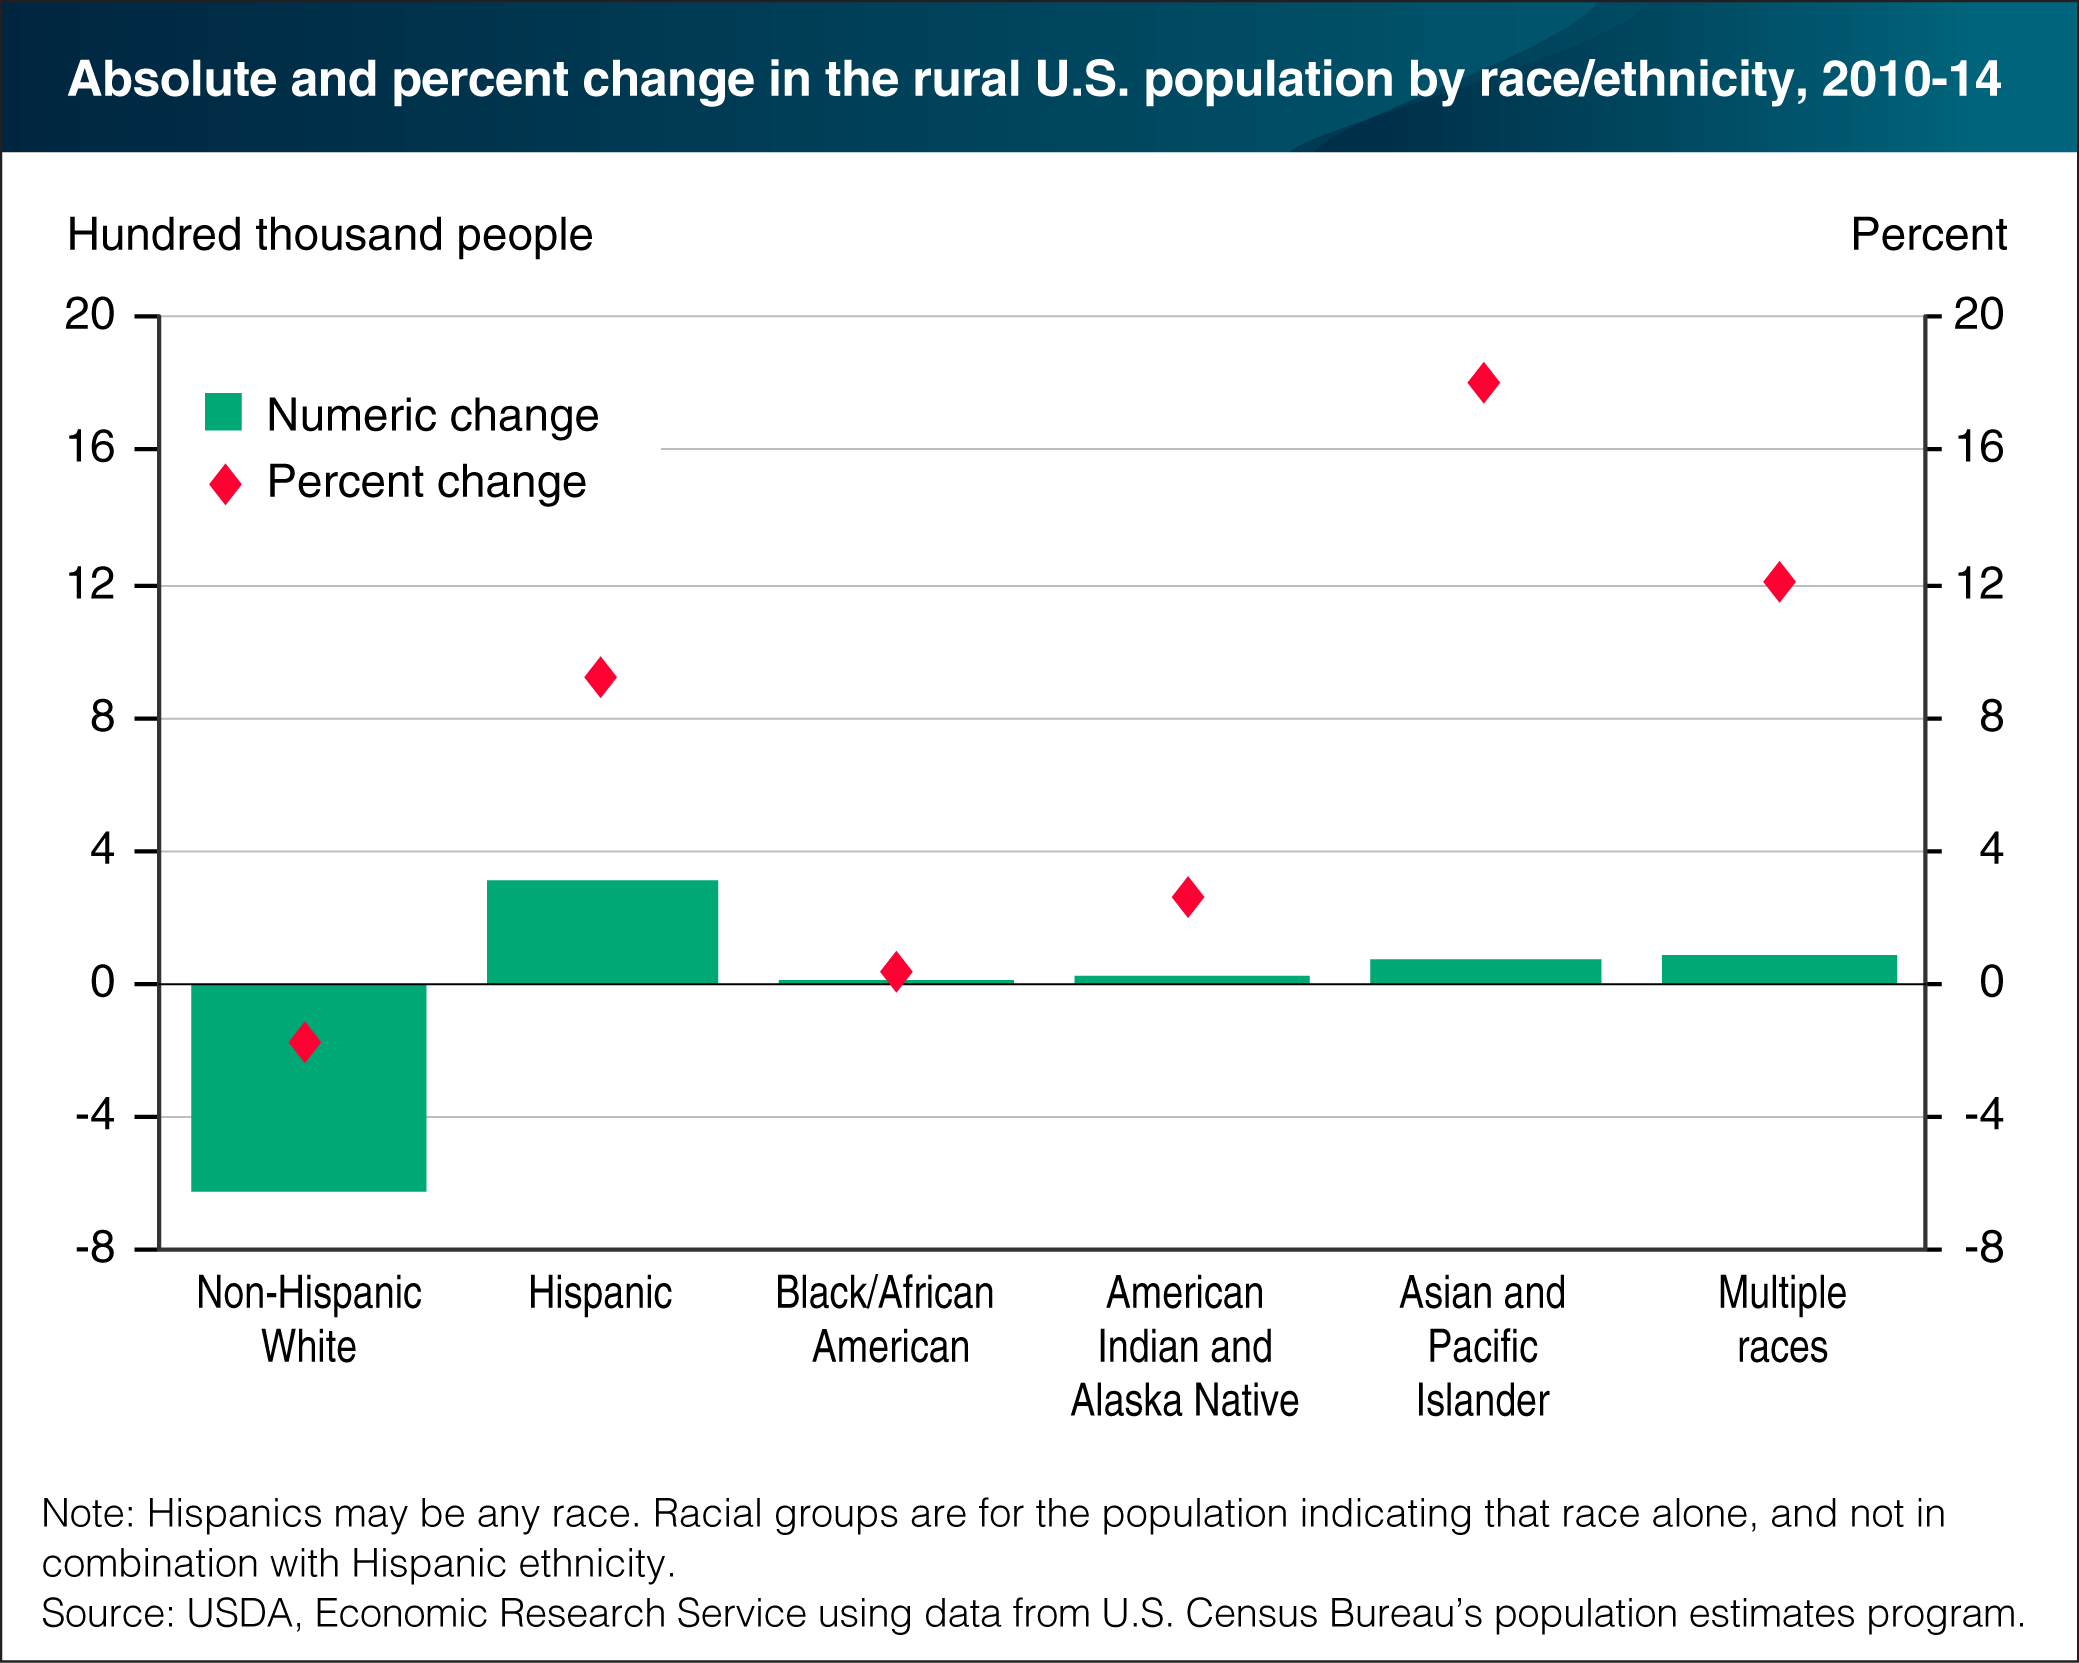
Racial and ethnic minorities made up 21 percent of rural residents in 2014. Hispanics (who may be of any race) and Asians are the fastest growing minority groups in the United States as a whole and in rural areas. Over 2010-14, the rural Hispanic population increased 9.2 percent, and their share of the total rural population rose from 7.5 to 8.2 percent. Asians and Pacific Islanders represent a small share of the rural population—about 1 percent—but their population grew by 18 percent between 2010 and 2014, while rural Native American and Black populations grew at more modest rates. This is in contrast to the rural non-Hispanic White population, which declined by 1.7 percent between 2010 and 2014. Overall rural population loss (which was -0.2 percent for the period) would have been much higher if not for the growth in the rural racial and ethnic minority groups. Rural minorities tend to be younger on average and have larger families than non-Hispanic Whites, and this, along with net migration, is reflected in the varying growth rates. This chart updates one found in the ERS publication, An Illustrated Guide to Research Findings from USDA's Economic Research Service.