

Food price inflation varies across U.S. metropolitan areas
- by David Levin and Annemarie Kuhns
- 5/26/2016
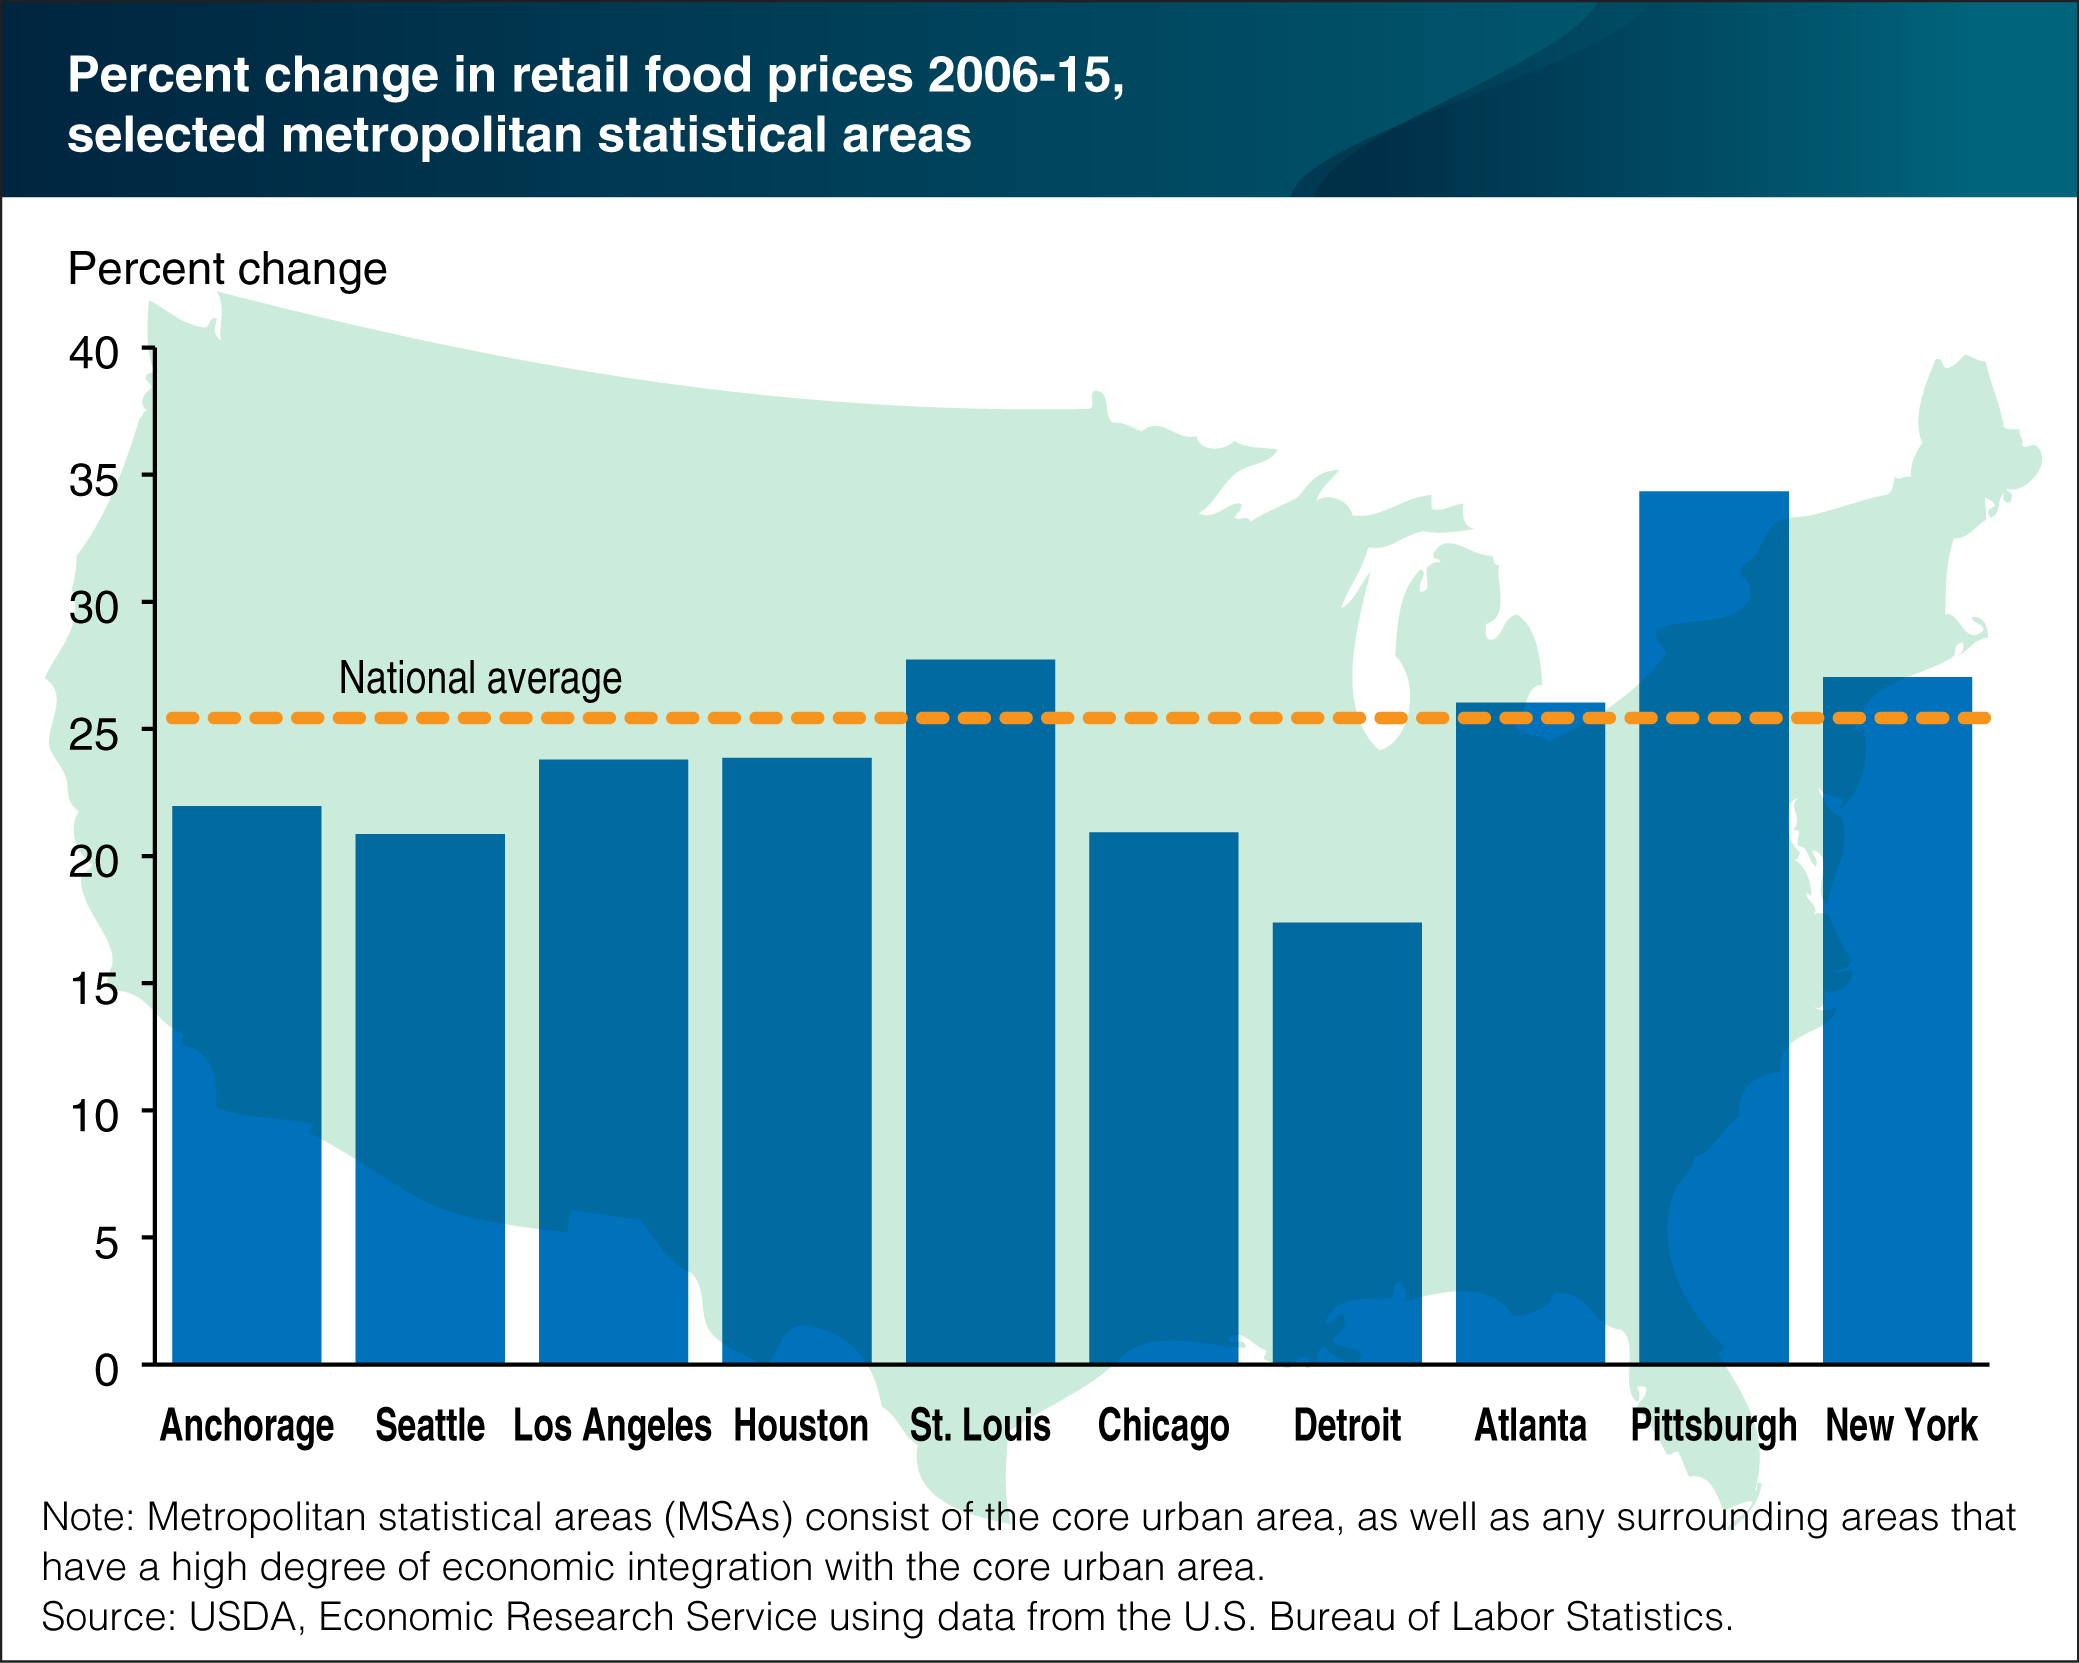
U.S. metropolitan statistical areas (MSAs) experience different rates of inflation for food sold in supermarkets, supercenters, convenience stores, and other retailers. For example, from 2006 to 2015, retail food prices rose 34.4 percent in Pittsburgh but only 17.4 percent in Detroit. Several factors account for variations in food price inflation across MSAs. Changes to the costs associated with transporting food products to the grocery store can also vary geographically, and volatile fuel prices can contribute to variation in retail food price inflation across MSAs. Fluctuations in retail overhead costs, such as labor and rent, may also differ from one area to another. Increases in retail overhead costs are often passed onto consumers as higher prices. However, in MSAs with falling consumer incomes, grocers may not be able to pass on price increases to budget-constrained consumers, dampening food price inflation. This chart appears in “Retail Food Price Inflation Varies Geographically” in the May 2016 issue of ERS’s Amber Waves magazine.