2016 food price inflation expected to exceed 2015
- by Annemarie Kuhns
- 2/25/2016

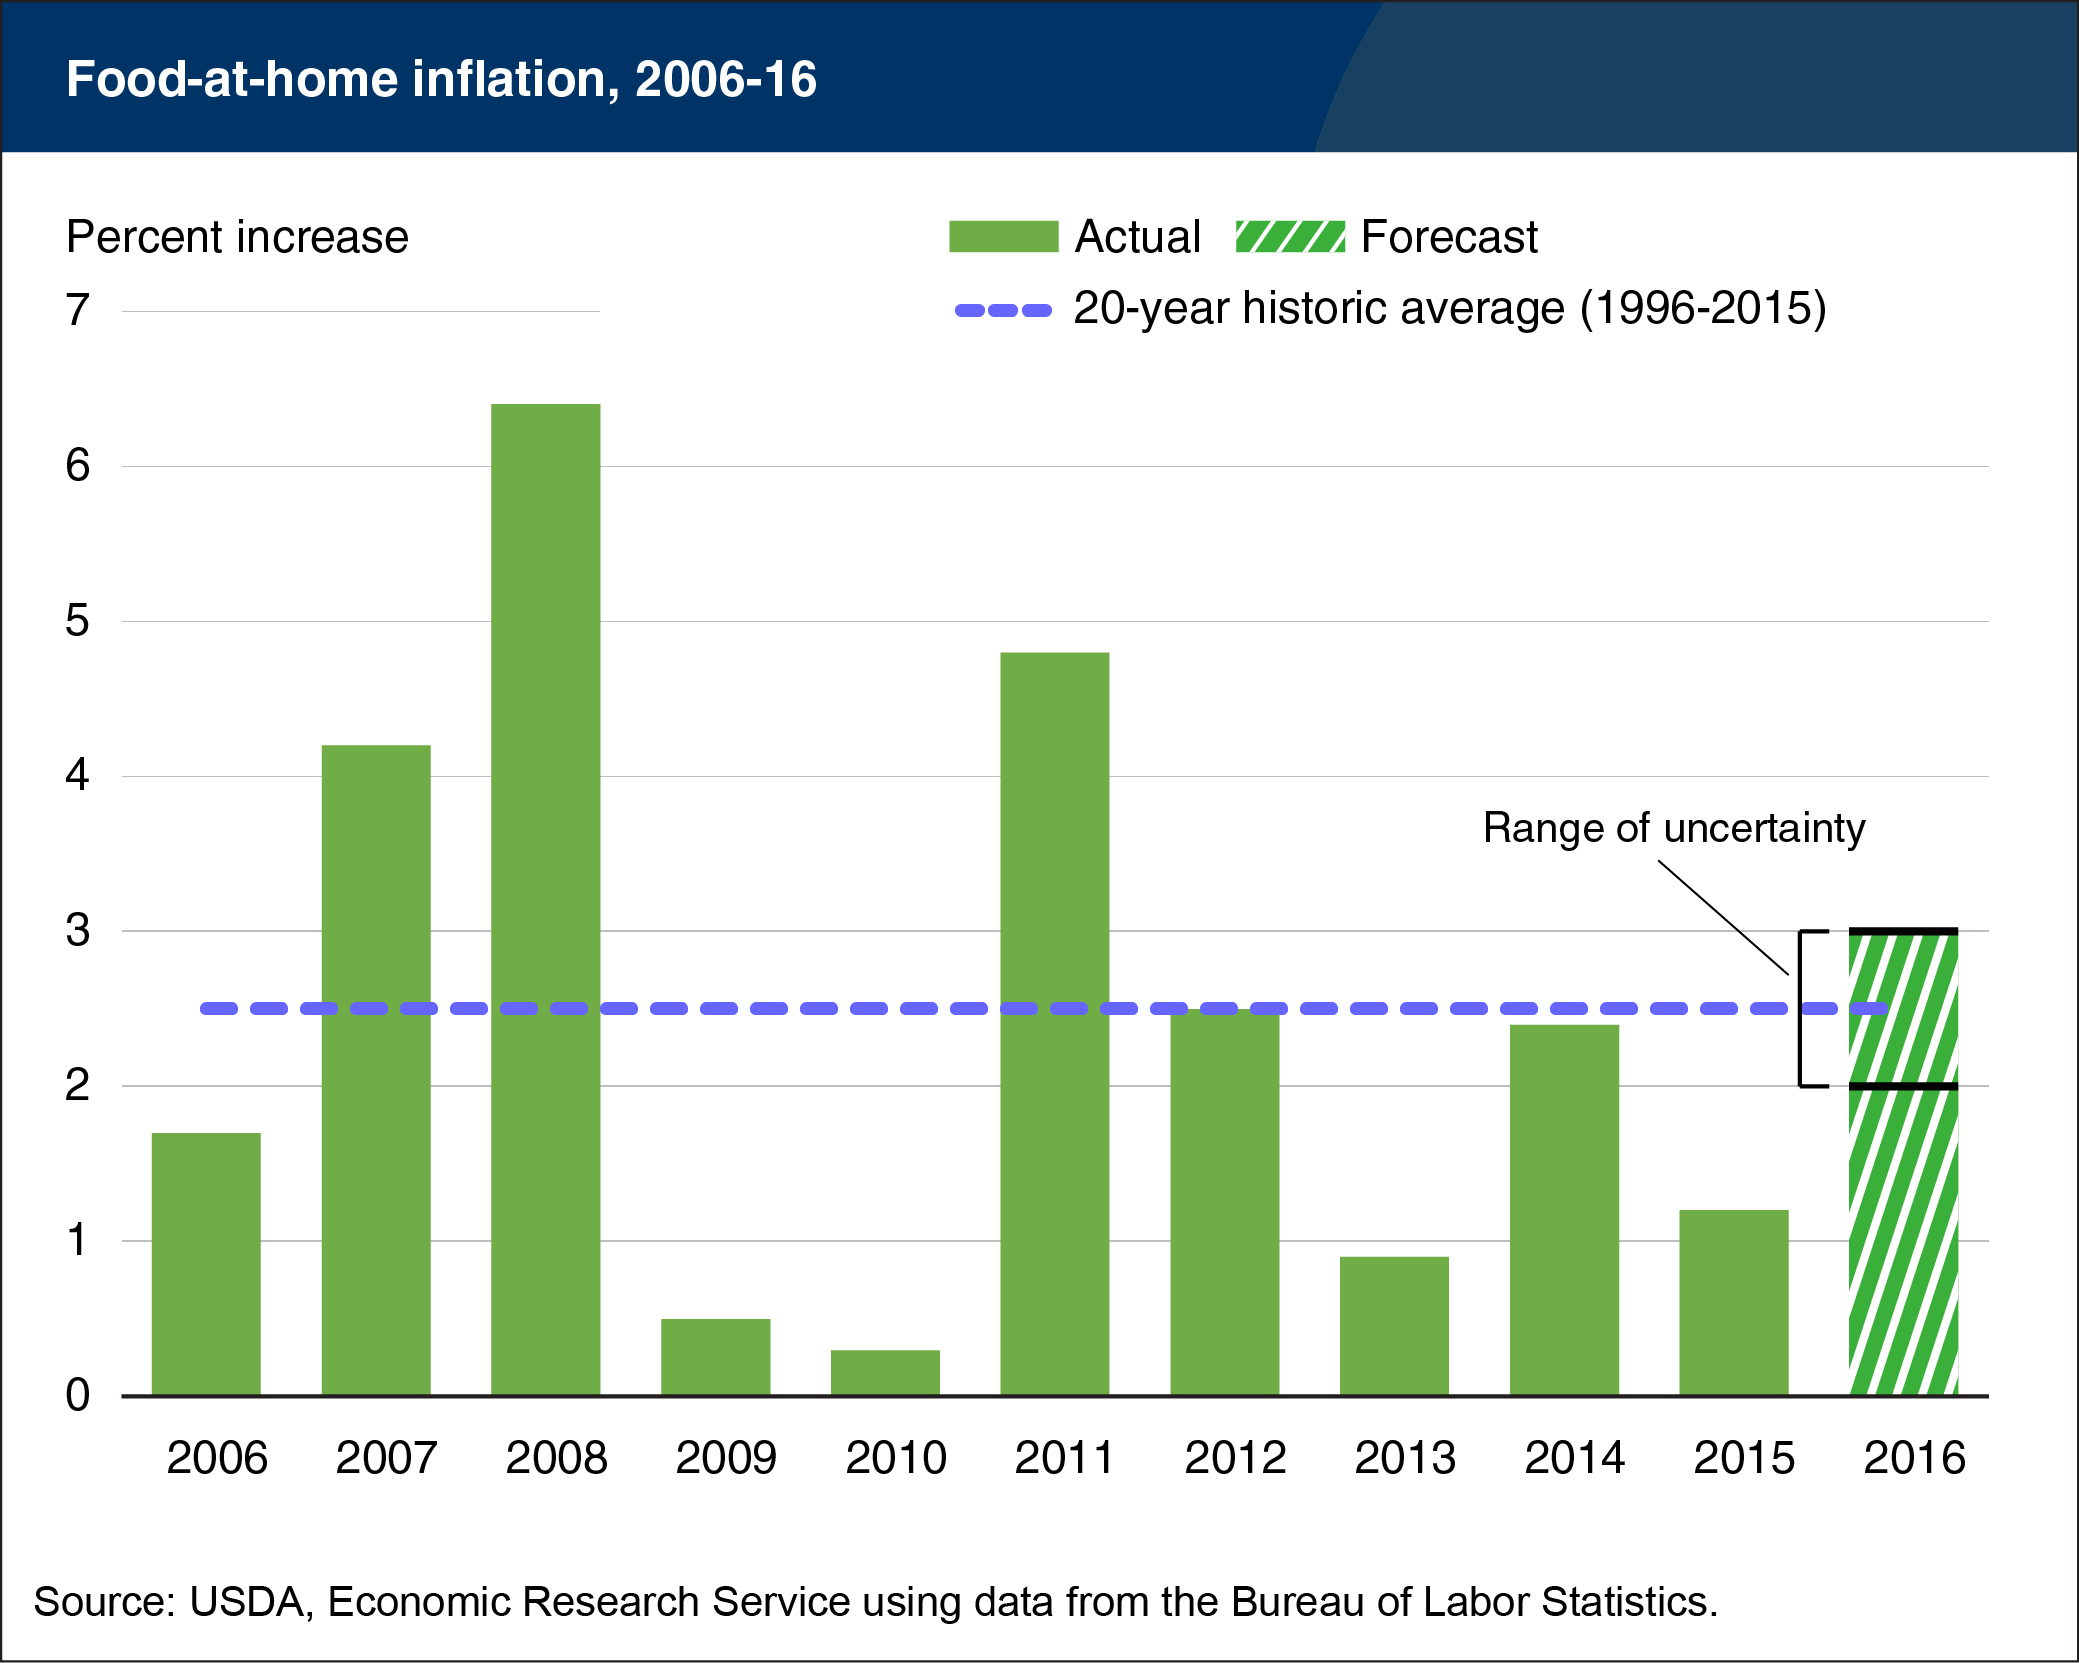
Over the last decade, retail food price inflation in the United States has bounced around a bit, with yearly price increases ranging from 0.3 to 6.4 percent. In 2007 and 2008, grocery store prices rose 4.2 and 6.4 percent, respectively—well above the 20-year annual average increase of 2.6 percent. Inflation during these years was largely due to a rapid increase in farm-level prices for rice, grains, and oilseeds. The low inflation in 2009 (0.5 percent) and 2010 (0.3 percent) reflected the Great Recession’s downward pressure on retail food price inflation. Prices again rose above average in 2011 as grocery prices adjusted post-recession. From 2012 through 2015, food price inflation varied, but stayed below average. Despite high egg and beef prices in 2015, food price inflation, at 1.2 percent, was less than 2014’s 2.4-percent rise. Lower pork, fresh fruit, and fats/oils prices helped ease overall food price inflation in 2015. In 2016, ERS expects retail food prices to increase between 2 and 3 percent, with some variation among grocery subcategories. For instance, fresh fruit prices are expected to rise 2.5 to 3.5 percent in 2016, while egg prices are expected to decrease between 0.5 and 1.5 percent. More information on ERS’s food price forecasts can be found in ERS’s Food Price Outlook data product, updated February 25, 2016.
We’d welcome your feedback!
Would you be willing to answer a few quick questions about your experience?

