

Per-capita participation in USDA's School Breakfast Program grew from 2009 to 2014 in almost all States
- by Katherine Ralston
- 1/29/2016
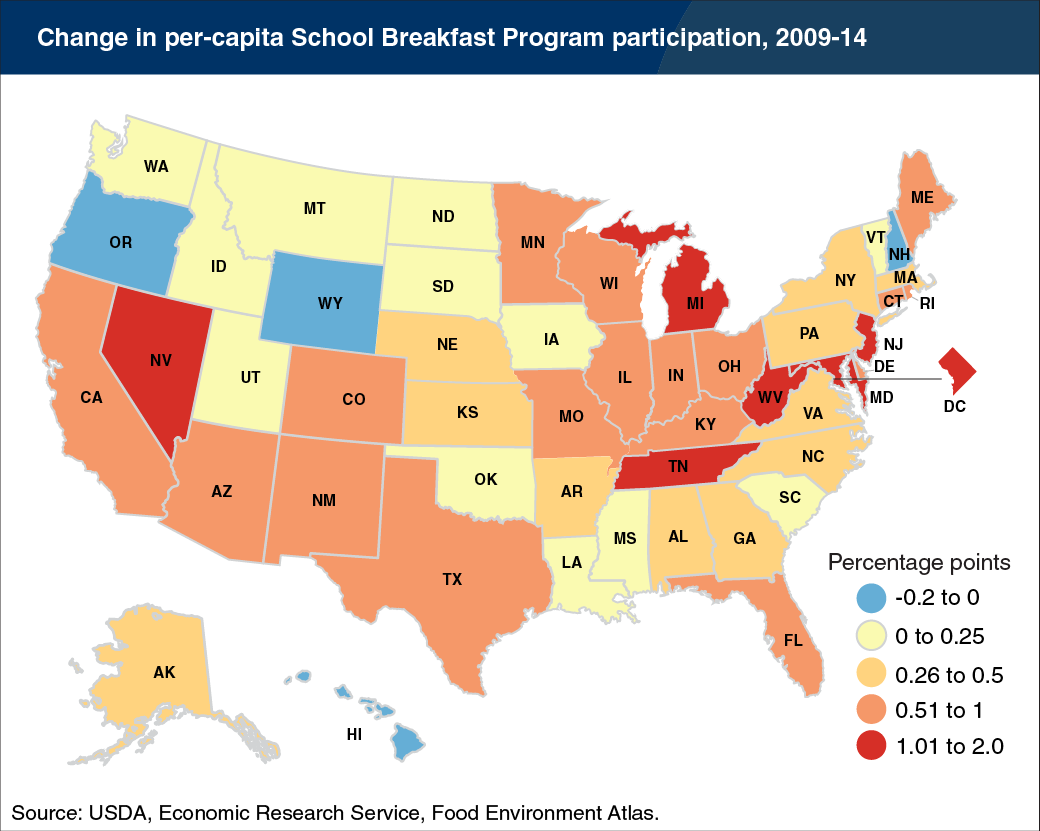
Per-capita participation in USDA’s School Breakfast Program (SBP) has increased from 3.6 participants per 100 U.S. residents in 2009 to 4.2 participants per 100 residents in 2014, and most States’ per-capita SBP participation levels rose. For most States, changes in population and in enrollment in schools that serve USDA school meals were less important than changes in the share of students who take school breakfast. For example, West Virginia’s increase from 5.1 to 7.1 SBP participants per 100 residents reflected small increases in the State’s population and school enrollments, and a large jump in the number of students taking school breakfast—increasing from 31 to 44 percent of students. In only four States did per-capita SBP participation levels decline, and these declines were 0.2 percentage point or less. School Breakfast Program participation across the whole United States has increased steadily from 11.1 million students in 2009 to 13.6 million in 2014 due to a variety of factors, including more schools offering the program, more schools offering free breakfast for all students, and increasing use of formats such as breakfast in the classroom, which reduces arrival-time barriers for many children. This map is from ERS’s Food Environment Atlas.