
Prevalence of food insecurity varied by household characteristics in 2014
- by Matthew P. Rabbitt and Alisha Coleman-Jensen
- 10/21/2015
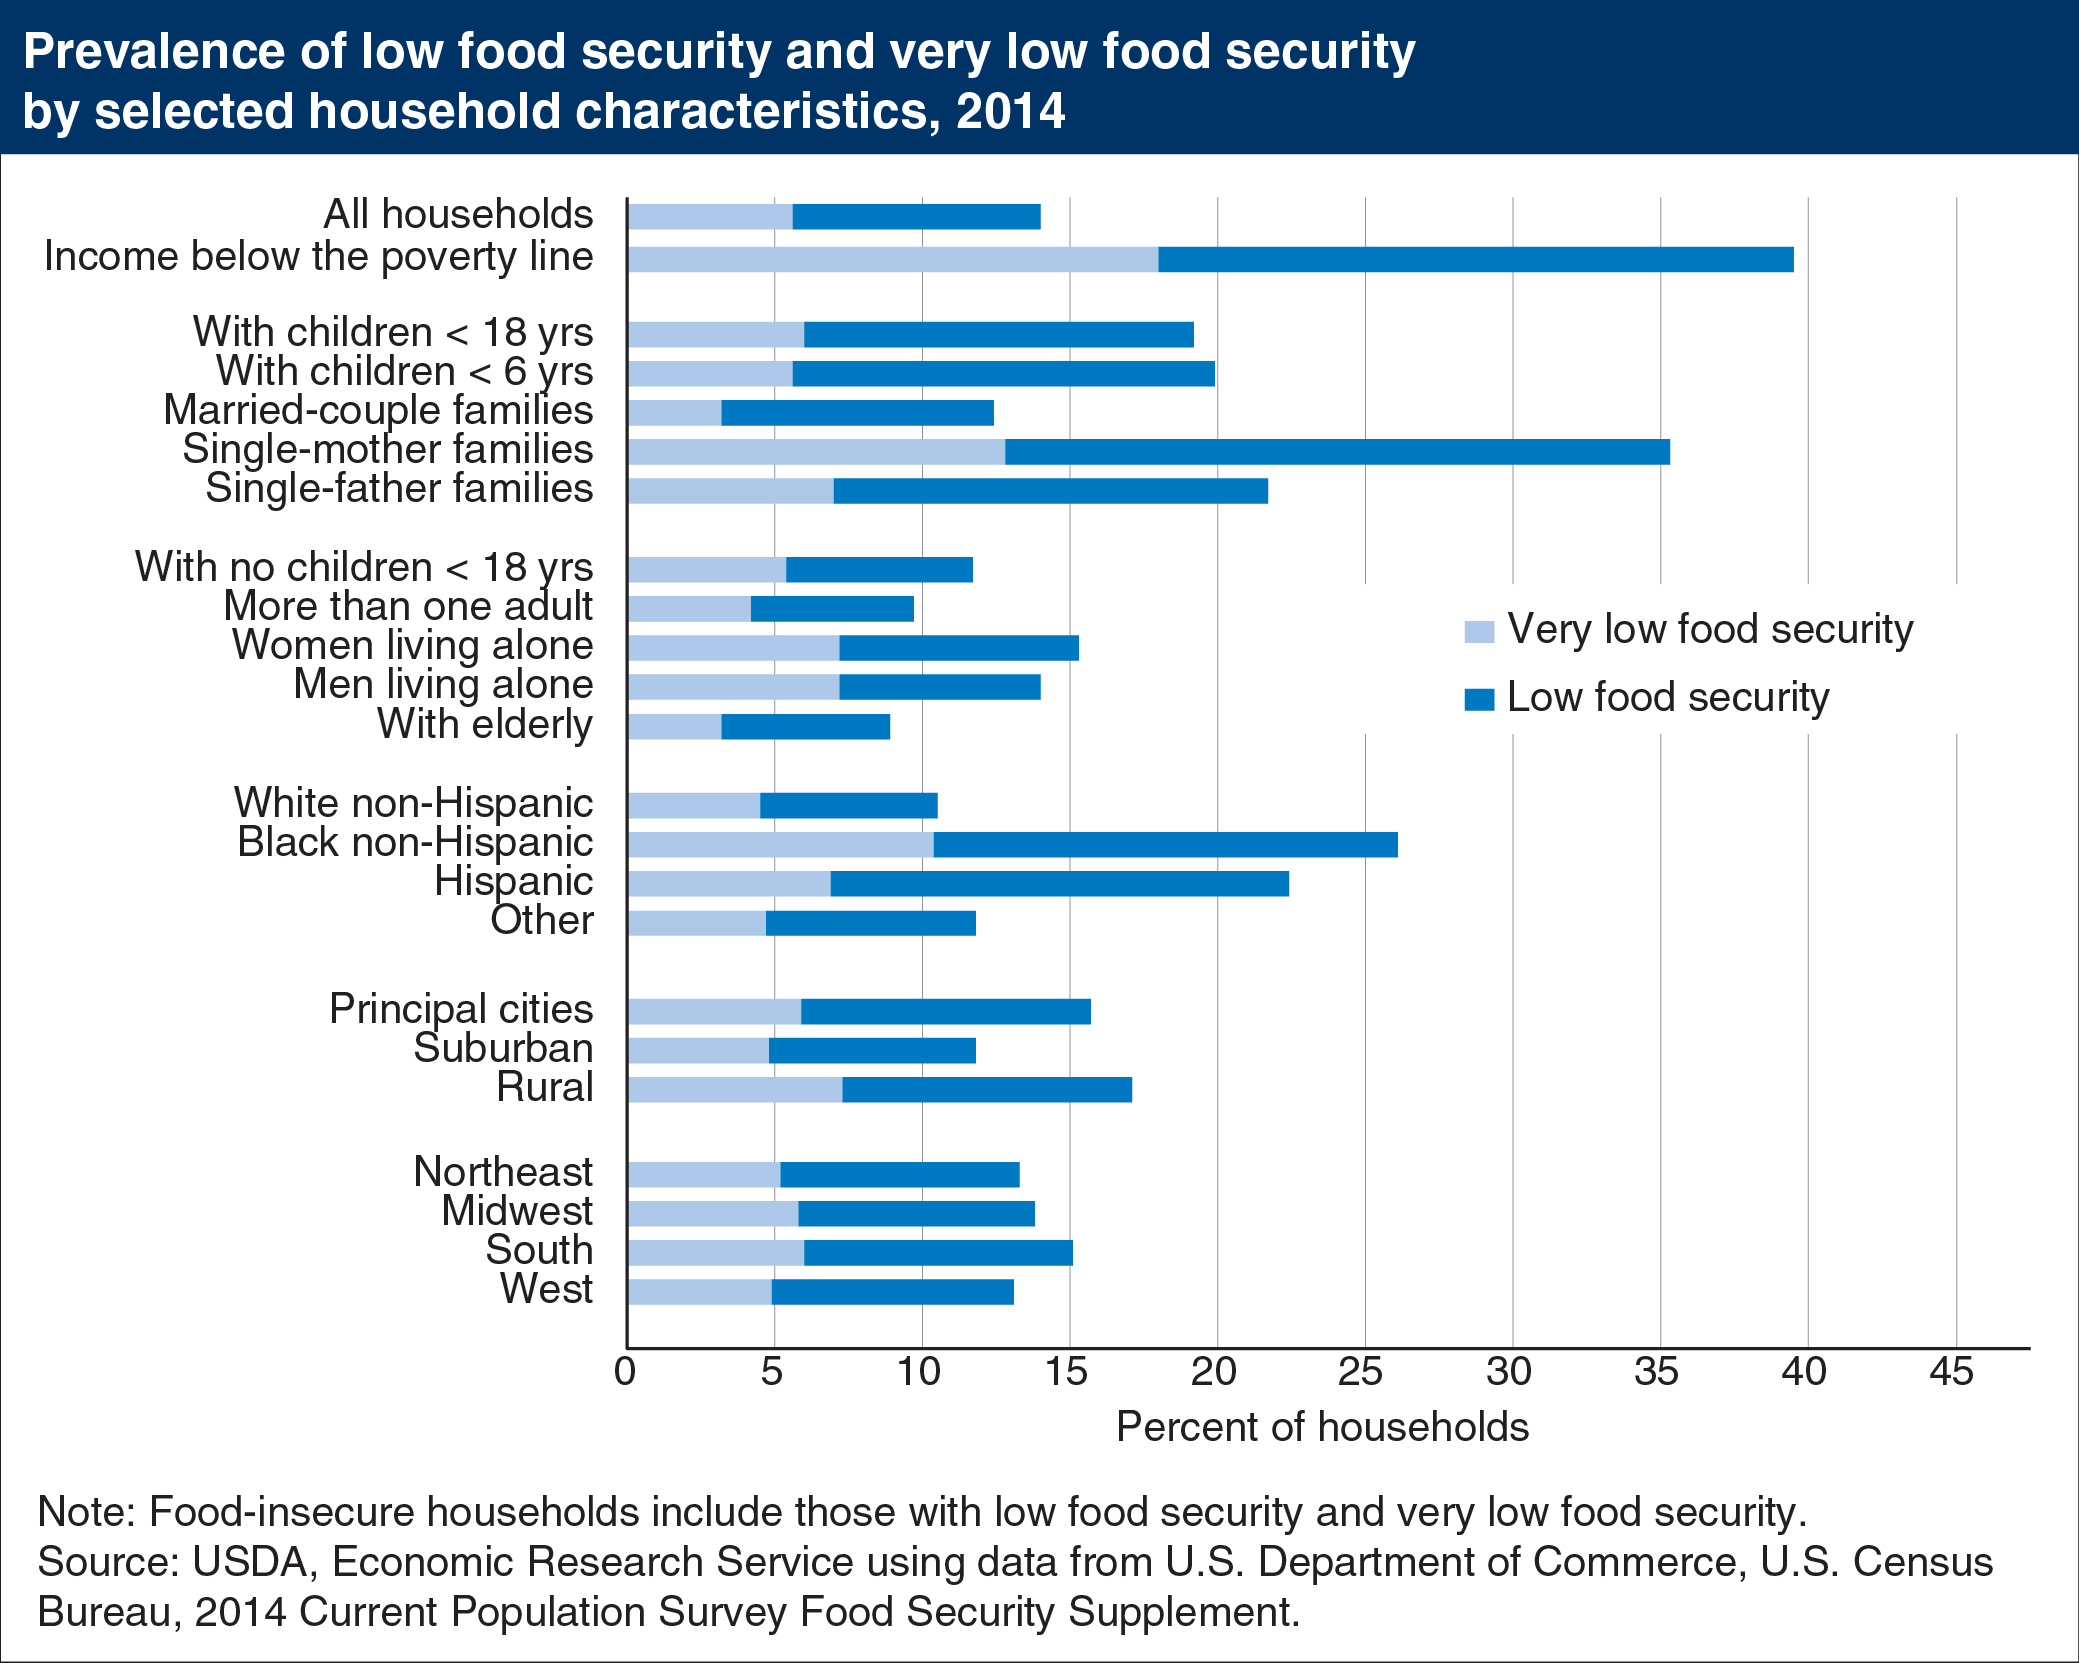
While the majority of U.S. households are food secure, a minority experience food insecurity at times during the year, meaning their access to adequate food for active, healthy living is limited by a lack of money or other resources. Some households experience very low food security, a more severe range of food insecurity, where food intake of one or more household members is reduced and normal eating patterns are disrupted. Food insecurity includes both very low food security and low food security. In 2014, 14.0 percent of all U.S households were food insecure. The prevalence of food insecurity was substantially higher for low-income households; 39.6 percent of households with incomes below the Federal poverty line were food insecure. Among all U.S. households, food insecurity rates were the highest for single-mother households (35.3 percent), and lowest for households with elderly members (8.9 percent). This chart appears in “Commemorating 20 years of U.S. Food Security Measurement” in the October 2015 issue of ERS’s Amber Waves magazine.