
Number of fast food restaurants per capita varies across the U.S.
- by Economic Research Service
- 8/27/2015
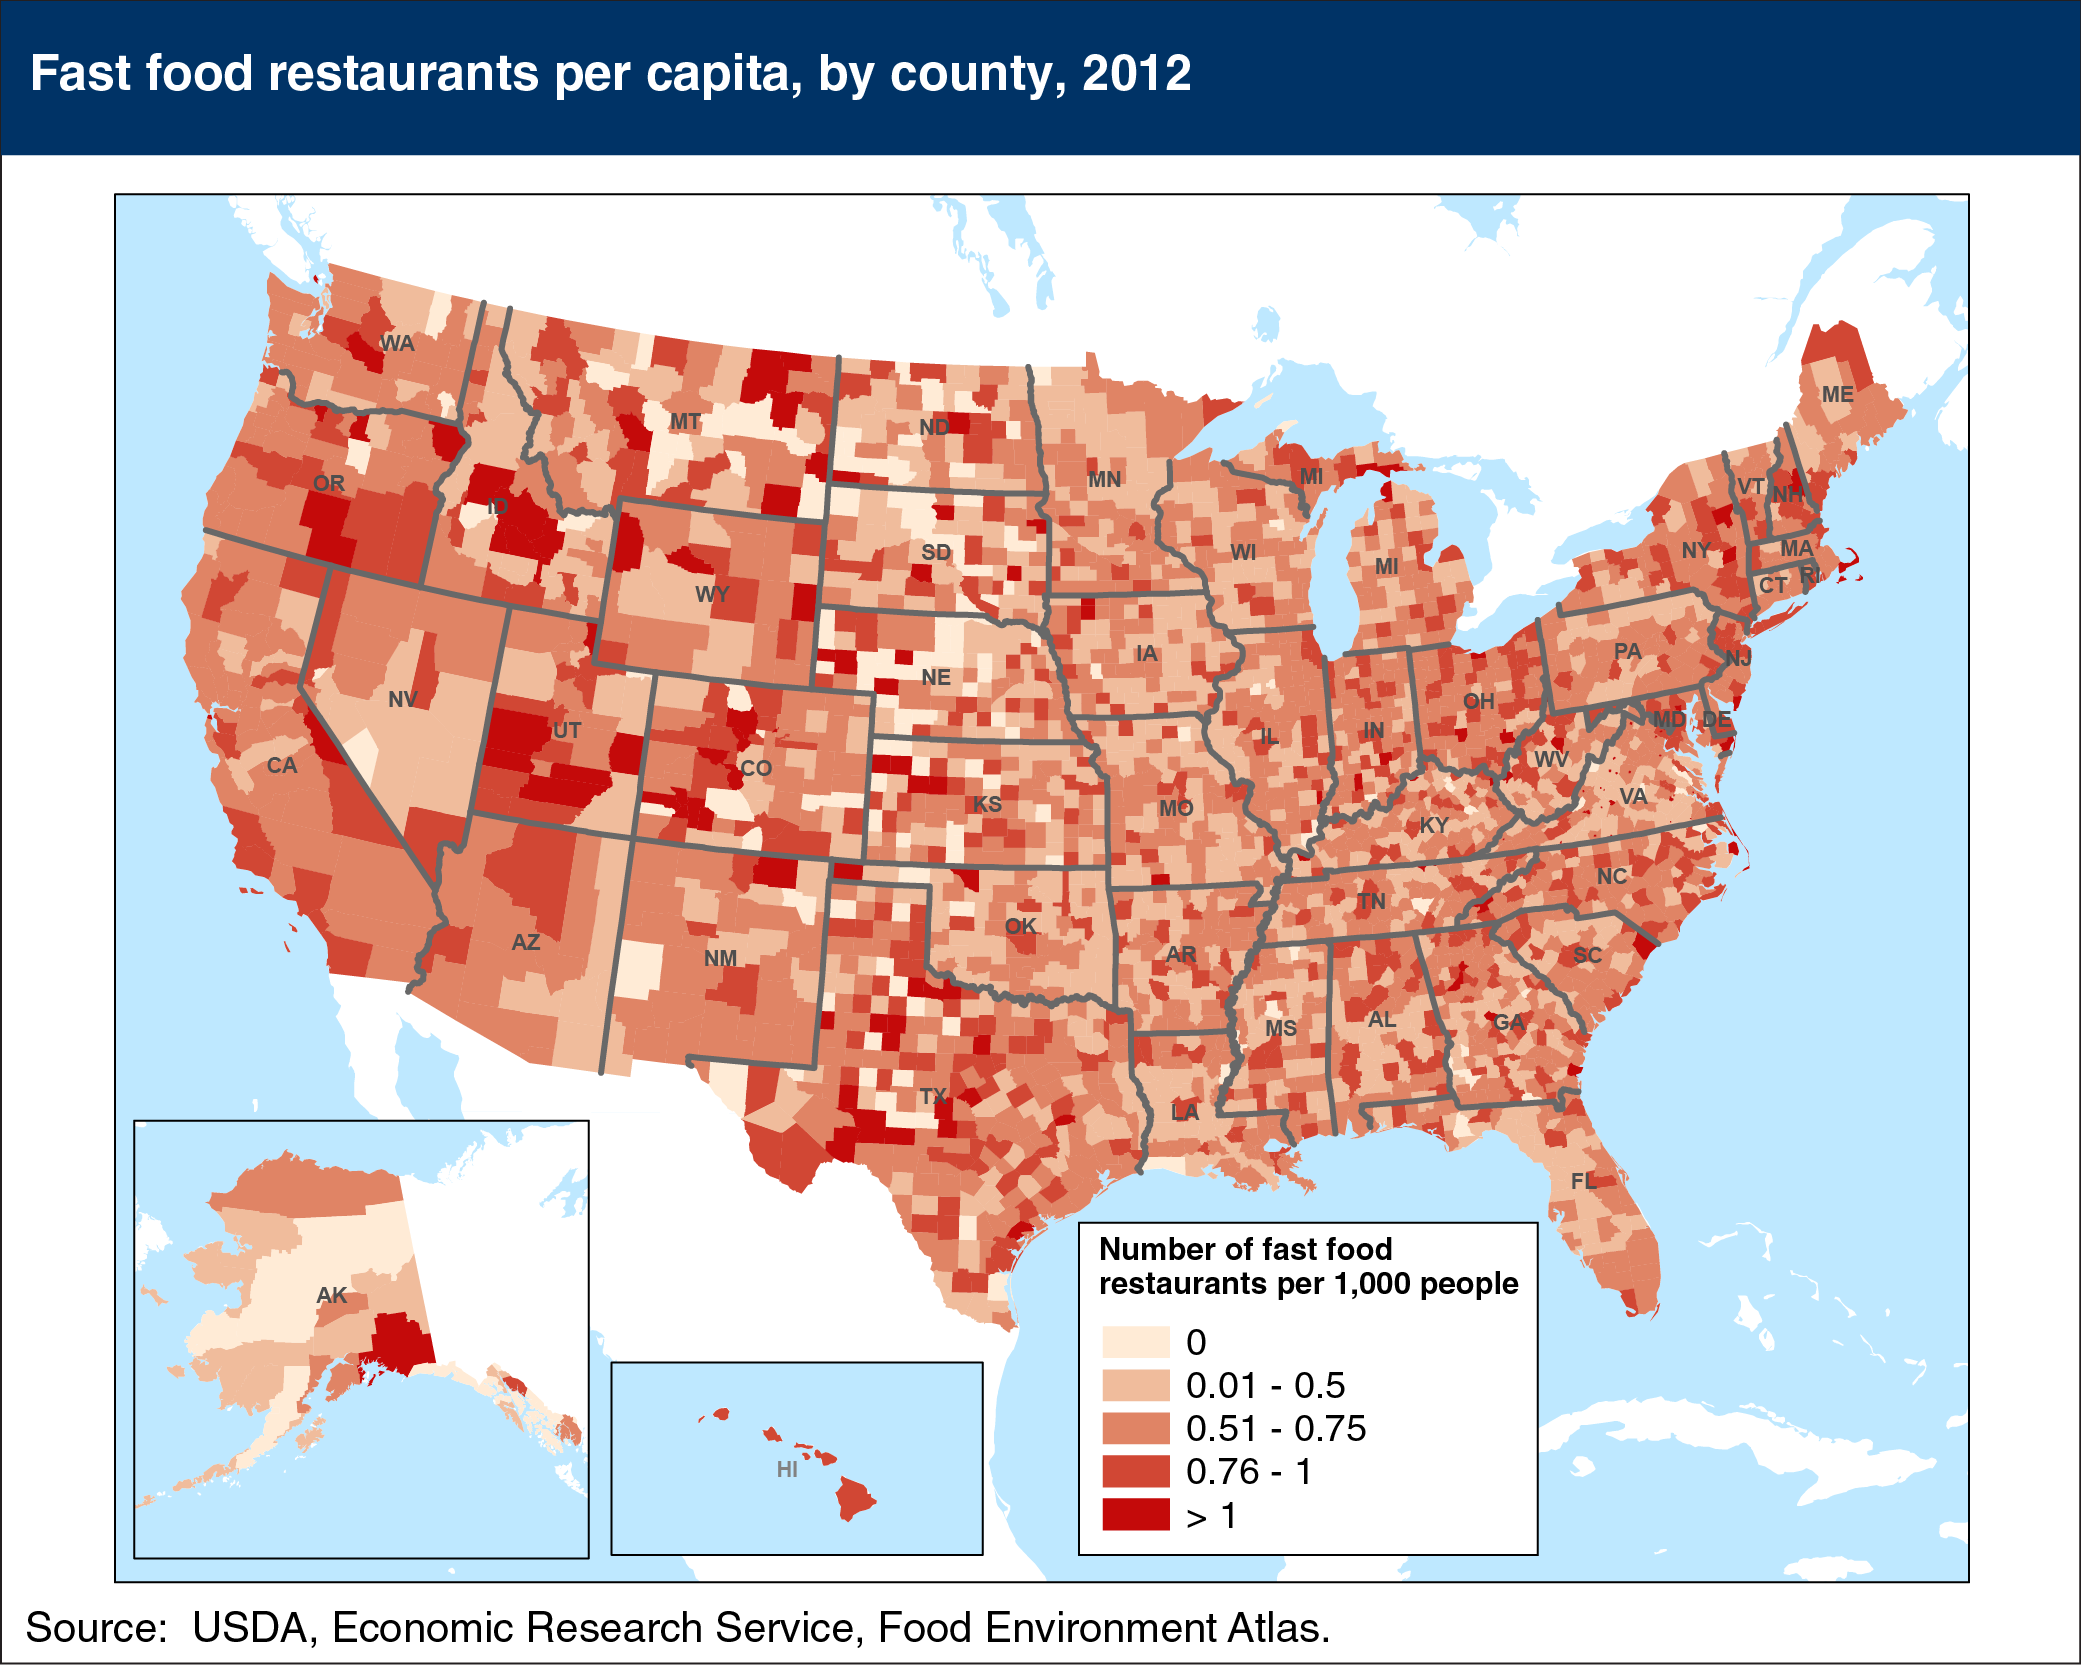
Almost half of all American households’ food expenditures occur in restaurants with wait staff, fast food places, and other away-from-home eating establishments. Studies by ERS and other researchers have shown that such eating out purchases tend to be of lower nutritional quality and contain more calories. The availability, convenience, and price of fast food is often suggested as a reason many Americans have poor dietary health. The number of fast food restaurants per capita varies across U.S. counties. Counties with relatively high numbers of fast food restaurants per capita (greater than 1 fast food restaurant for every 1,000 people) include counties comprised of densely populated cities (for example, New York, NY) and counties with major tourist attractions (for example Summit County, CO). Counties with very few fast food restaurants per capita are spread throughout the country, but tend to be those with smaller populations. This chart is one of the 40 updated maps in ERS’s Food Environment Atlas, posted on August 10, 2015.