
Nonbulk agricultural exports support more business activity than bulk exports
- by Suresh Persaud
- 3/9/2015
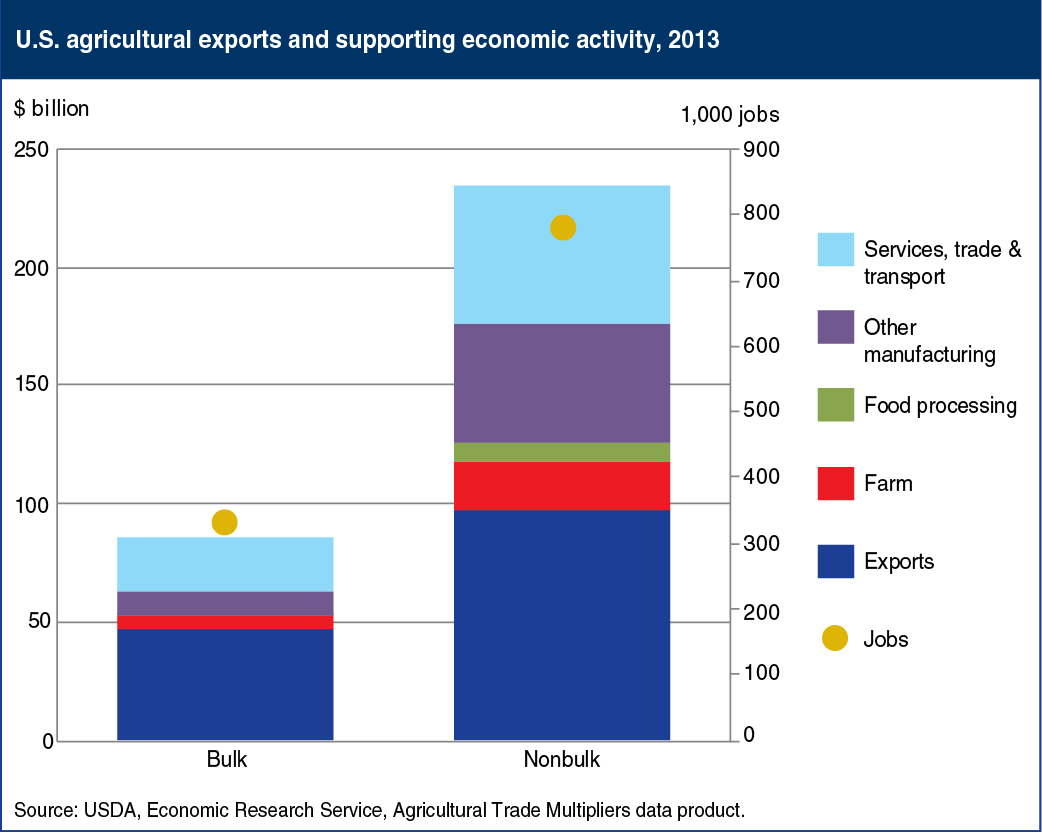
Nonbulk agricultural exports (processed or high-value) have a larger proportional effect on the U.S. nonfarm economy than bulk exports (defined as soybeans and other oilseeds, wheat, rice, corn and other feed grains, tobacco, and cotton). In 2013, nonbulk exports of $96.9 billion stimulated an additional $137.7 billion of business activity (i.e., each dollar of non-bulk exports generated $1.42 of additional output). Bulk exports valued at $47.5 billion produced an additional $38.3 billion of business activity (i.e., each dollar of bulk exports generated $0.81 of additional output). In contrast to bulk exports, nonbulk exports of higher value or more processed products led to proportionally more additional business activity in the food processing, other manufacturing, and services, trade, and transport sectors. Of the 1.09 million jobs associated with U.S. agricultural exports in 2013, 768,300 (70 percent) supported nonbulk exports. This chart comes from the Agricultural Trade Multipliers data product.