
Grocery shopping patterns vary by income and SNAP participation
- by Lisa Mancino and Joanne Guthrie
- 12/8/2014
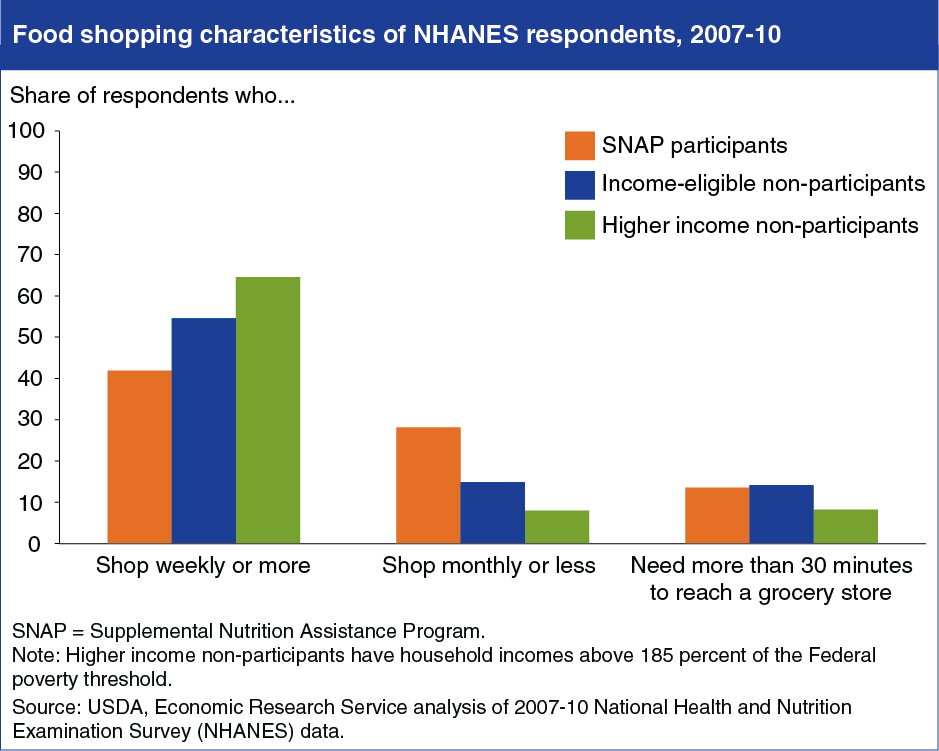
Participants in USDA’s Supplemental Nutrition Assistance Program (SNAP) place a high value on how well food keeps when making purchase decisions in the grocery store; a closer look at their shopping behavior may help to explain this. Using data from the Flexible Consumer Behavior Survey module of the National Health and Nutrition Examination Survey (NHANES), ERS researchers found that SNAP participants and low-income non-SNAP participants had a more difficult time getting to the grocery store than higher income shoppers; 14 percent of both groups reported that it took them more than 30 minutes to get to a grocery store, compared with only 8 percent of higher income shoppers. SNAP shoppers are less likely to shop weekly and more likely to shop once a month or less. This may be related to the monthly distribution of SNAP benefits. Just under 30 percent of SNAP shoppers reported that they shopped once a month or less compared to 15 percent of low-income non-SNAP participants and 8 percent of higher income shoppers. Choosing foods that keep well is likely to be important to consumers that shop less frequently. This chart appears in “SNAP Households Must Balance Multiple Priorities to Achieve a Healthful Diet” in the November 2014 issue of ERS’s Amber Waves magazine.