
Pesticide composition and use has changed over past five decades
- by Jorge Fernandez-Cornejo
- 5/28/2014
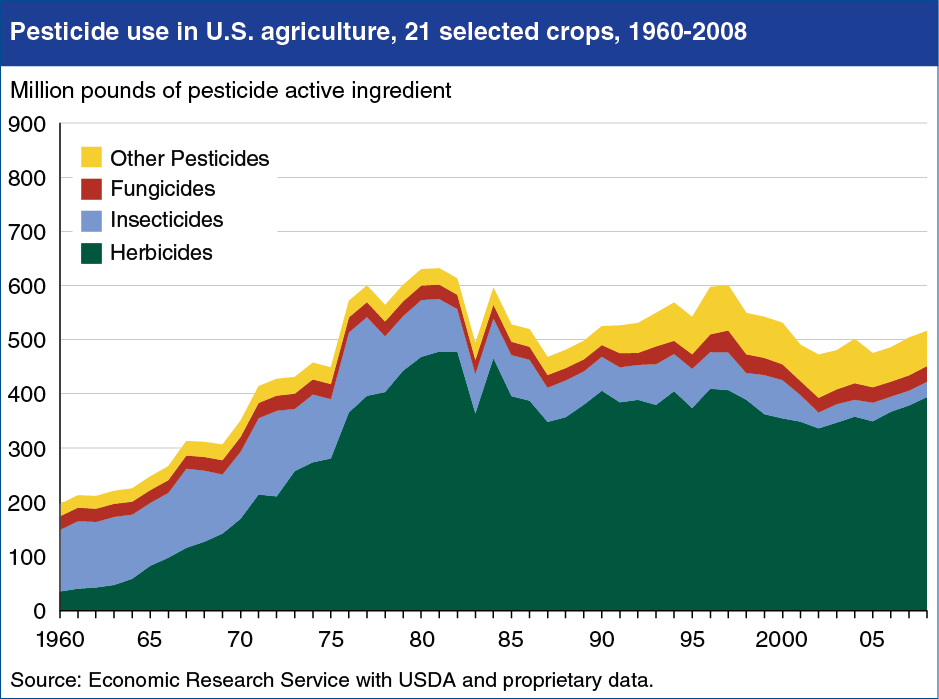
Pesticide use in U.S. agriculture grew rapidly between 1960 and 1981 before declining slightly over the last 3 decades. The total quantity of pesticide active ingredients applied to 21 selected crops (that accounted for more than 70 percent of the sector’s total use of pesticides) grew from 196 million pounds in 1960 to 632 million pounds in 1981. Over this period, the share of planted acres treated with herbicides for weed control increased, as did the total planted acreage of corn, wheat, and particularly soybeans, further increasing herbicide use. Since 1980, over 90 percent of corn, cotton, and soybean acres were treated with herbicides, leaving little room for increased use. The application of improved active ingredients, new modes of action having lower per-acre application rates, and recent technological innovations in pest management have also contributed to declining pesticide use. While farmers have used insecticides and fungicides for many decades, the widespread use of herbicides is a more recent phenomenon, as weed control was previously achieved by cultivation and other methods. This chart is found in the ERS report, Pesticide Use in U.S. Agriculture: 21 Selected Crops, 1960-2008, EIB-124, May 2014.
We’d welcome your feedback!
Would you be willing to answer a few quick questions about your experience?