
Small acreage farm numbers and sales differ by commodity specialization
- by Doris Newton
- 5/1/2014
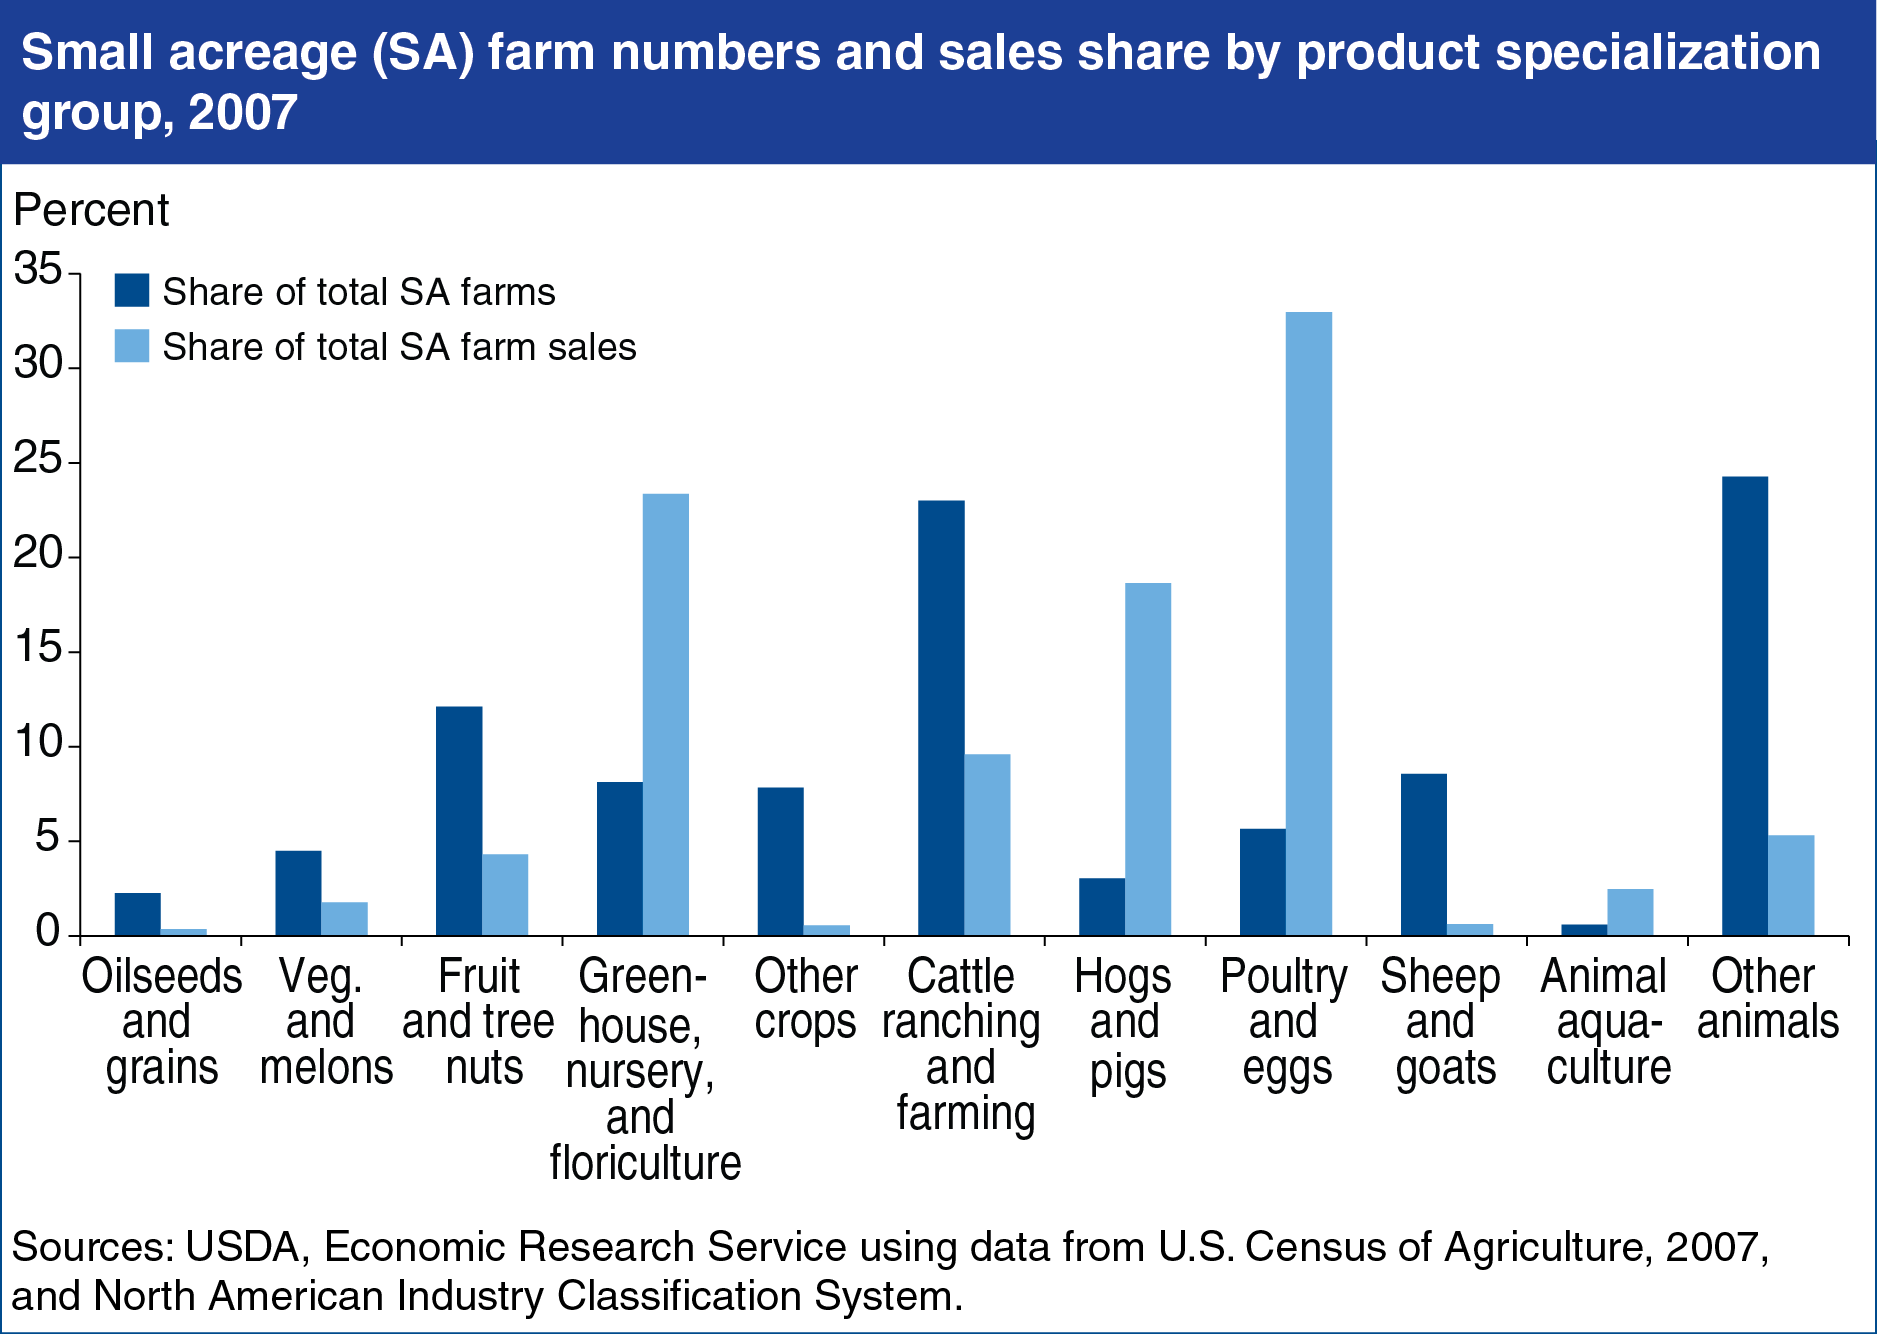
According to the 2007 Census of Agriculture, approximately 294,000 farms, or 13 percent of all U.S. farms, operated on 10 or fewer acres. Collectively, these small acreage (SA) farms operated only 0.18 percent of all U.S. farmland in 2007, but were responsible for approximately $9 billion in farm sales, or 3 percent of the U.S. total. More than half of all SA farms specialized in three broad product groups—other animals (primarily horses), cattle, and fruit and tree nuts; however, when combined, farms with these specialties accounted for only one-fifth of SA sales in 2007. Seventy-five percent of SA sales were in three other product groups—poultry and eggs, hogs and pigs, and greenhouse/nursery—though these products were produced on only 15 percent of SA farms. Most SA farms produce very little, if any, farm products for sale; only about one out of six reported gross sales of $10,000 or more in 2007. This chart can be found in Working the Land With 10 Acres: Small Acreage Farming in the U.S., EIB-123, April 2014.
We’d welcome your feedback!
Would you be willing to answer a few quick questions about your experience?