
Persistence of poverty varies across the U.S.
- by Economic Research Service
- 11/5/2013
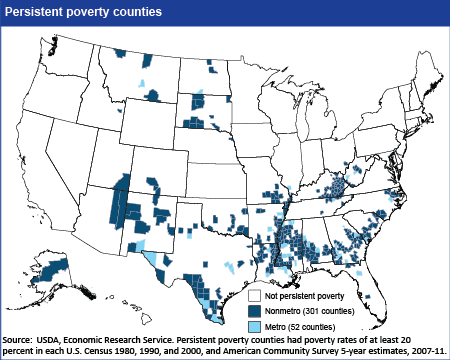
An important dimension of poverty is time—an area that has a high level of poverty this year, but not next year, is likely better off than an area that has a high level of poverty in both years. To shed light on this aspect of poverty, ERS has defined counties as being persistently poor if 20 percent or more of their populations were living in poverty over the last 30 years (measured by the 1980, 1990 and 2000 decennial censuses and 2007-2011 American Community Survey 5-year estimates). Using this definition, there are currently 353 persistently poor counties in the United States, comprising 11.2 percent of all U.S. counties. The large majority (301, or 85.3 percent) of the persistent-poverty counties are nonmetro, accounting for 15.2 percent of all nonmetro counties. Persistent poverty also demonstrates a strong regional pattern, with nearly 84 percent of persistent-poverty counties in the South, comprising more than 20 percent of all counties in the region. This map is found in Geography of Poverty, in the Rural Poverty and Well-being topic page on the ERS website, updated September 2013.