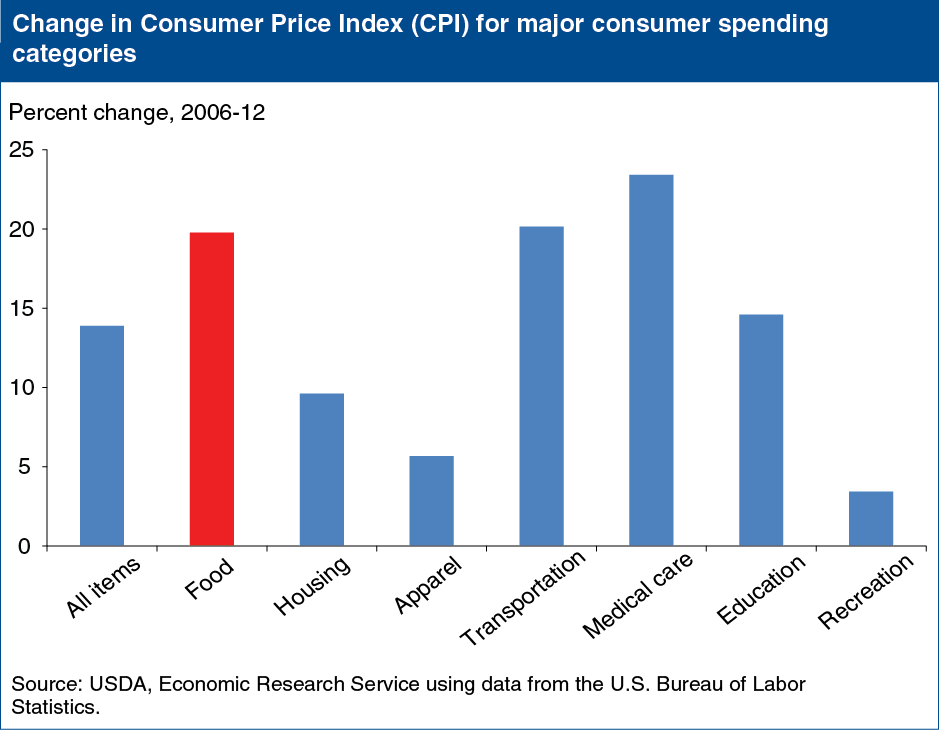
Rising food prices have pushed up overall price inflation in recent years
- by Economic Research Service
- 8/27/2013

For most of the last two decades, the all-food Consumer Price Index (CPI) has followed a fairly predictable pattern of about 2-3 percent inflation each year. However, since 2006, a series of interrelated factors—including spikes in energy prices, major weather events, shocks to global food commodity markets, and the U.S. economic recession and subsequent recovery—have resulted in annual changes in the all-food CPI ranging from a 0.8-percent increase in 2010 to a 5.5-percent jump in 2008. Along with this heightened volatility, food price increases have outpaced increases in the all-items CPI, largely due to rising U.S. farm prices for corn, wheat, soybeans, and other food commodities driving up food prices. Between 2006 and 2012, the all-food CPI rose close to 20 percent compared with a 14-percent increase in the all-items CPI. Among major consumer spending categories, only prices for transportation, which includes a number of energy price measures, and medical care have risen faster than food prices. This chart appears in “Price Inflation for Food Outpacing Many Other Spending Categories” in ERS’s Amber Waves magazine, August 2013.

