
Hay disappearance falls with tight supplies and rising prices
- by Economic Research Service
- 7/9/2014
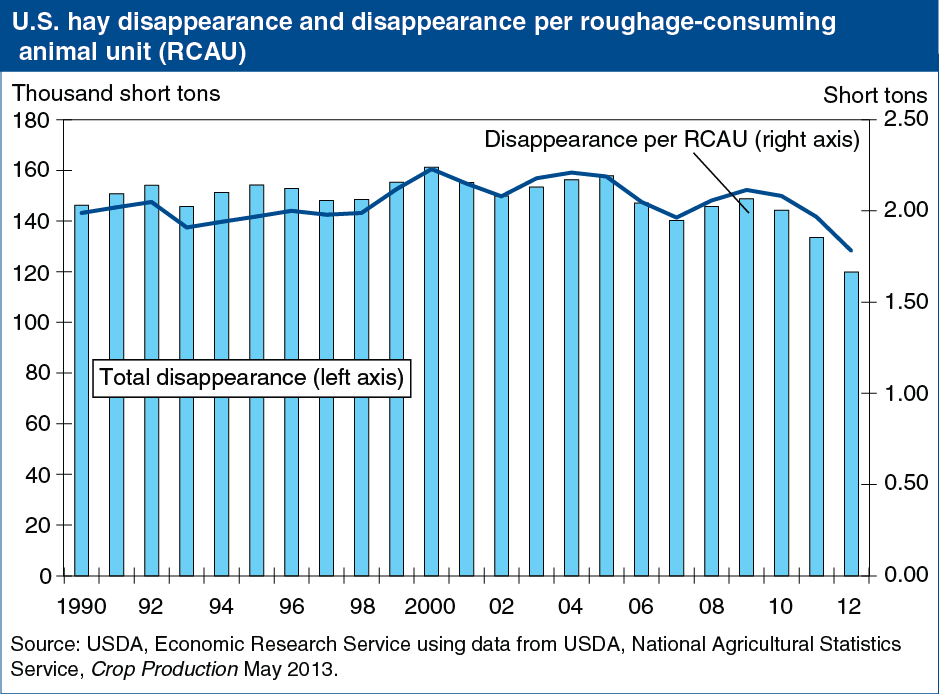
U.S. hay disappearance (production adjusted for net trade and changes in stocks) declined in 2012/13 (May/April), with both total disappearance and disappearance per roughage-consuming animal unit (RCAU) falling to the lowest levels on recent record. Disappearance per RCAU relates hay disappearance to the size and composition of the livestock herd (dairy cows, dairy heifers, cattle on feed, sheep, goats, horses, etc.) and the feed rations of different types of livestock. A decline in hay disappearance per RCAU indicates declining use of hay relative to standard feed rations. December-May disappearance for the 2012/13 crop year was the lowest since the 1978/79 crop year. The May 10 USDA-NASS Crop Production report placed U.S. onfarm hay stocks on May 1, 2013 at 14.16 million tons, the lowest on record. Tight supplies and high prices are behind declining disappearance; the average all-hay price for April of $203 per ton was the highest on record. However, high hay prices during 2012/13 have not raised farmers’ intentions to harvest significantly more acres in 2013/14 as concerns about water availability and competition from other crops contribute to reduced harvested area, particularly in New England and Midwestern States. This chart can be found in the Feed Grains Chart Gallery.
We’d welcome your feedback!
Would you be willing to answer a few quick questions about your experience?