
Expiration date was most popular food label for adults, followed by Nutrition Facts
- by Brandon J. Restrepo
- 5/28/2025
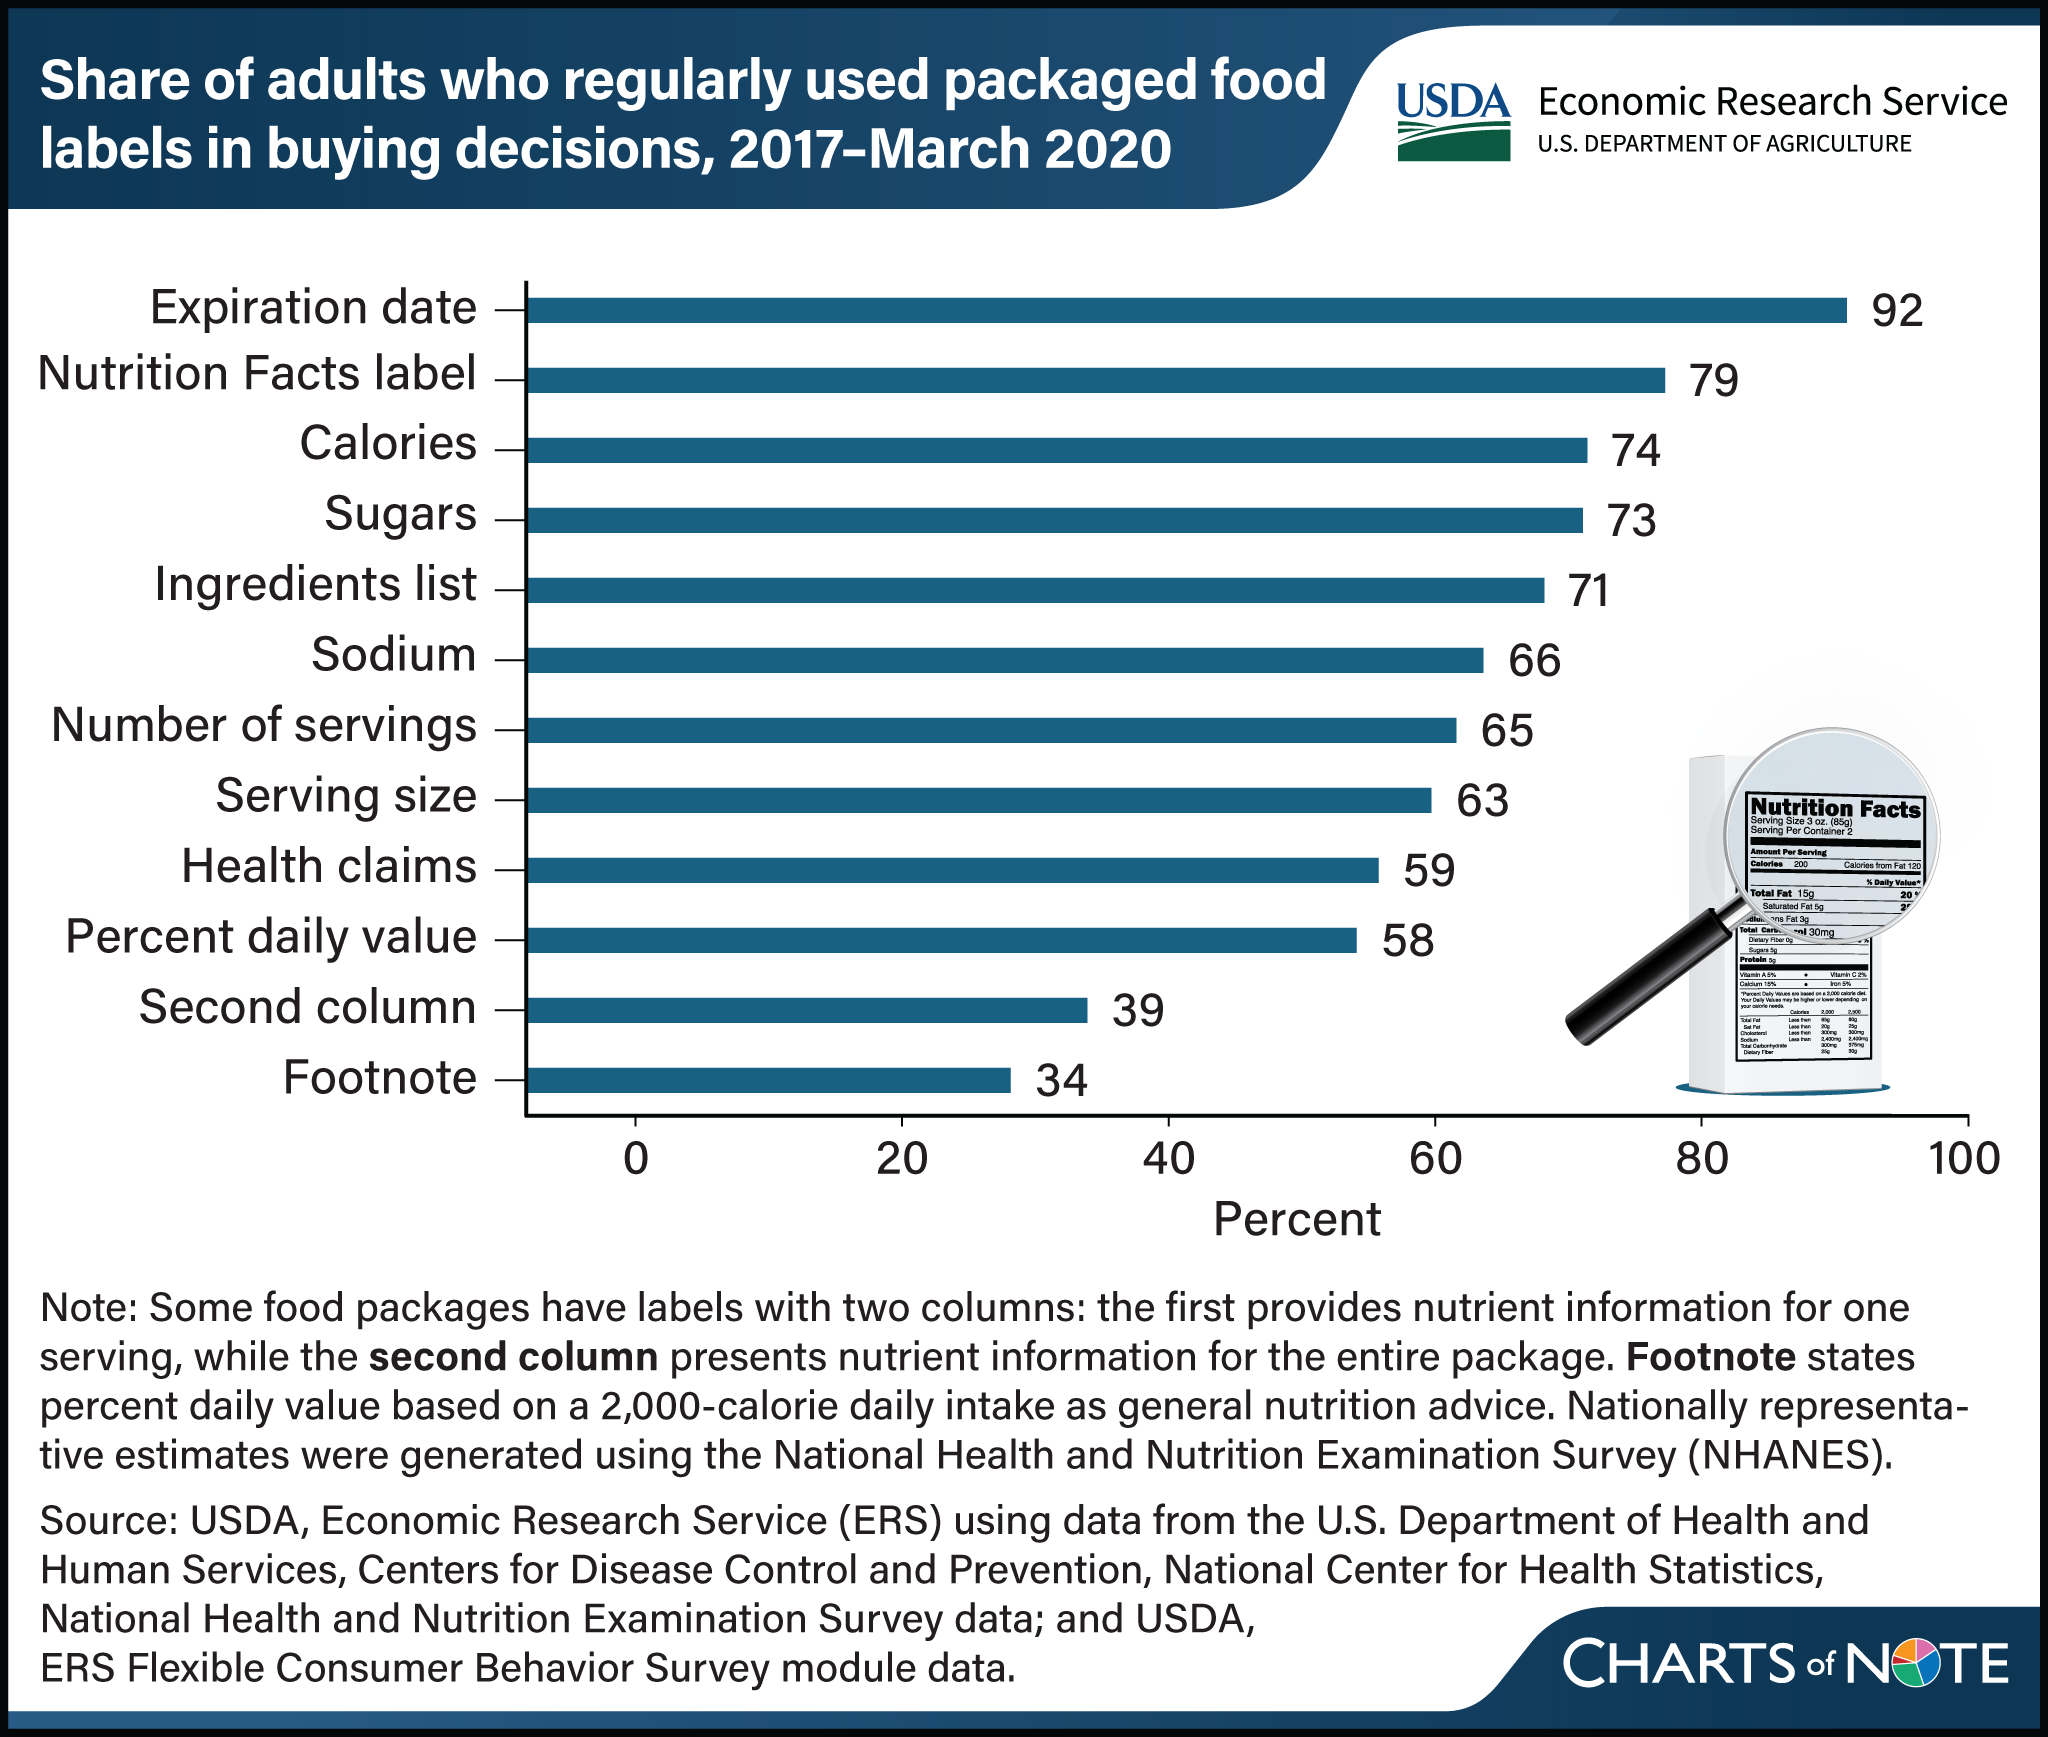
From 2017 to March 2020, 79 percent of U.S. adults aged 18 and older reported they regularly used the Nutrition Facts label when deciding to buy a packaged food product, according to the nationally representative Flexible Consumer Behavior Survey (FCBS) module of the National Health and Nutrition Examination Survey (NHANES). Regular use is defined as using the label “sometimes,” “most of the time,” or “always” in food purchasing decisions. Consumers made use of some types of information more than others. Nutrition Facts labels on packaged foods list the amount of calories, fat, fiber, carbohydrates, and other nutritional information, all of which helps shoppers compare products and make informed choices. Other types of information, such as health claims, the ingredients list, and the expiration date, are not included on the Nutrition Facts labels, but sometimes appear on packaged food labels. Over 9 in 10 consumers (92 percent) reported regularly using the expiration date. Slightly under three-fourths of consumers reported regularly using information on calories (74 percent), sugars (73 percent), and the ingredients list (71 percent). Just shy of two-thirds of consumers reported regularly using information on sodium (66 percent), number of servings (65 percent), and serving size (63 percent). Fewer consumers reported regularly using health claims (59 percent), percent daily value (58 percent), the second column (39 percent), and the footnote (34 percent). The second column presents nutrient information for the entire package and the footnote states percent daily value based on a 2,000-calorie diet. Since 2007, USDA, Economic Research Service (ERS) has sponsored the FCBS by providing partial funding for data collection and survey administration. These data appear in the ERS report Who Regularly Uses the Nutrition Facts Label? Exploring Demographic, Socioeconomic, and Geographic Differences, published in May 2025.