
Industry specialization varies across rural counties, favoring manufacturing and farming
- by Austin Sanders and James C. Davis
- 5/7/2025
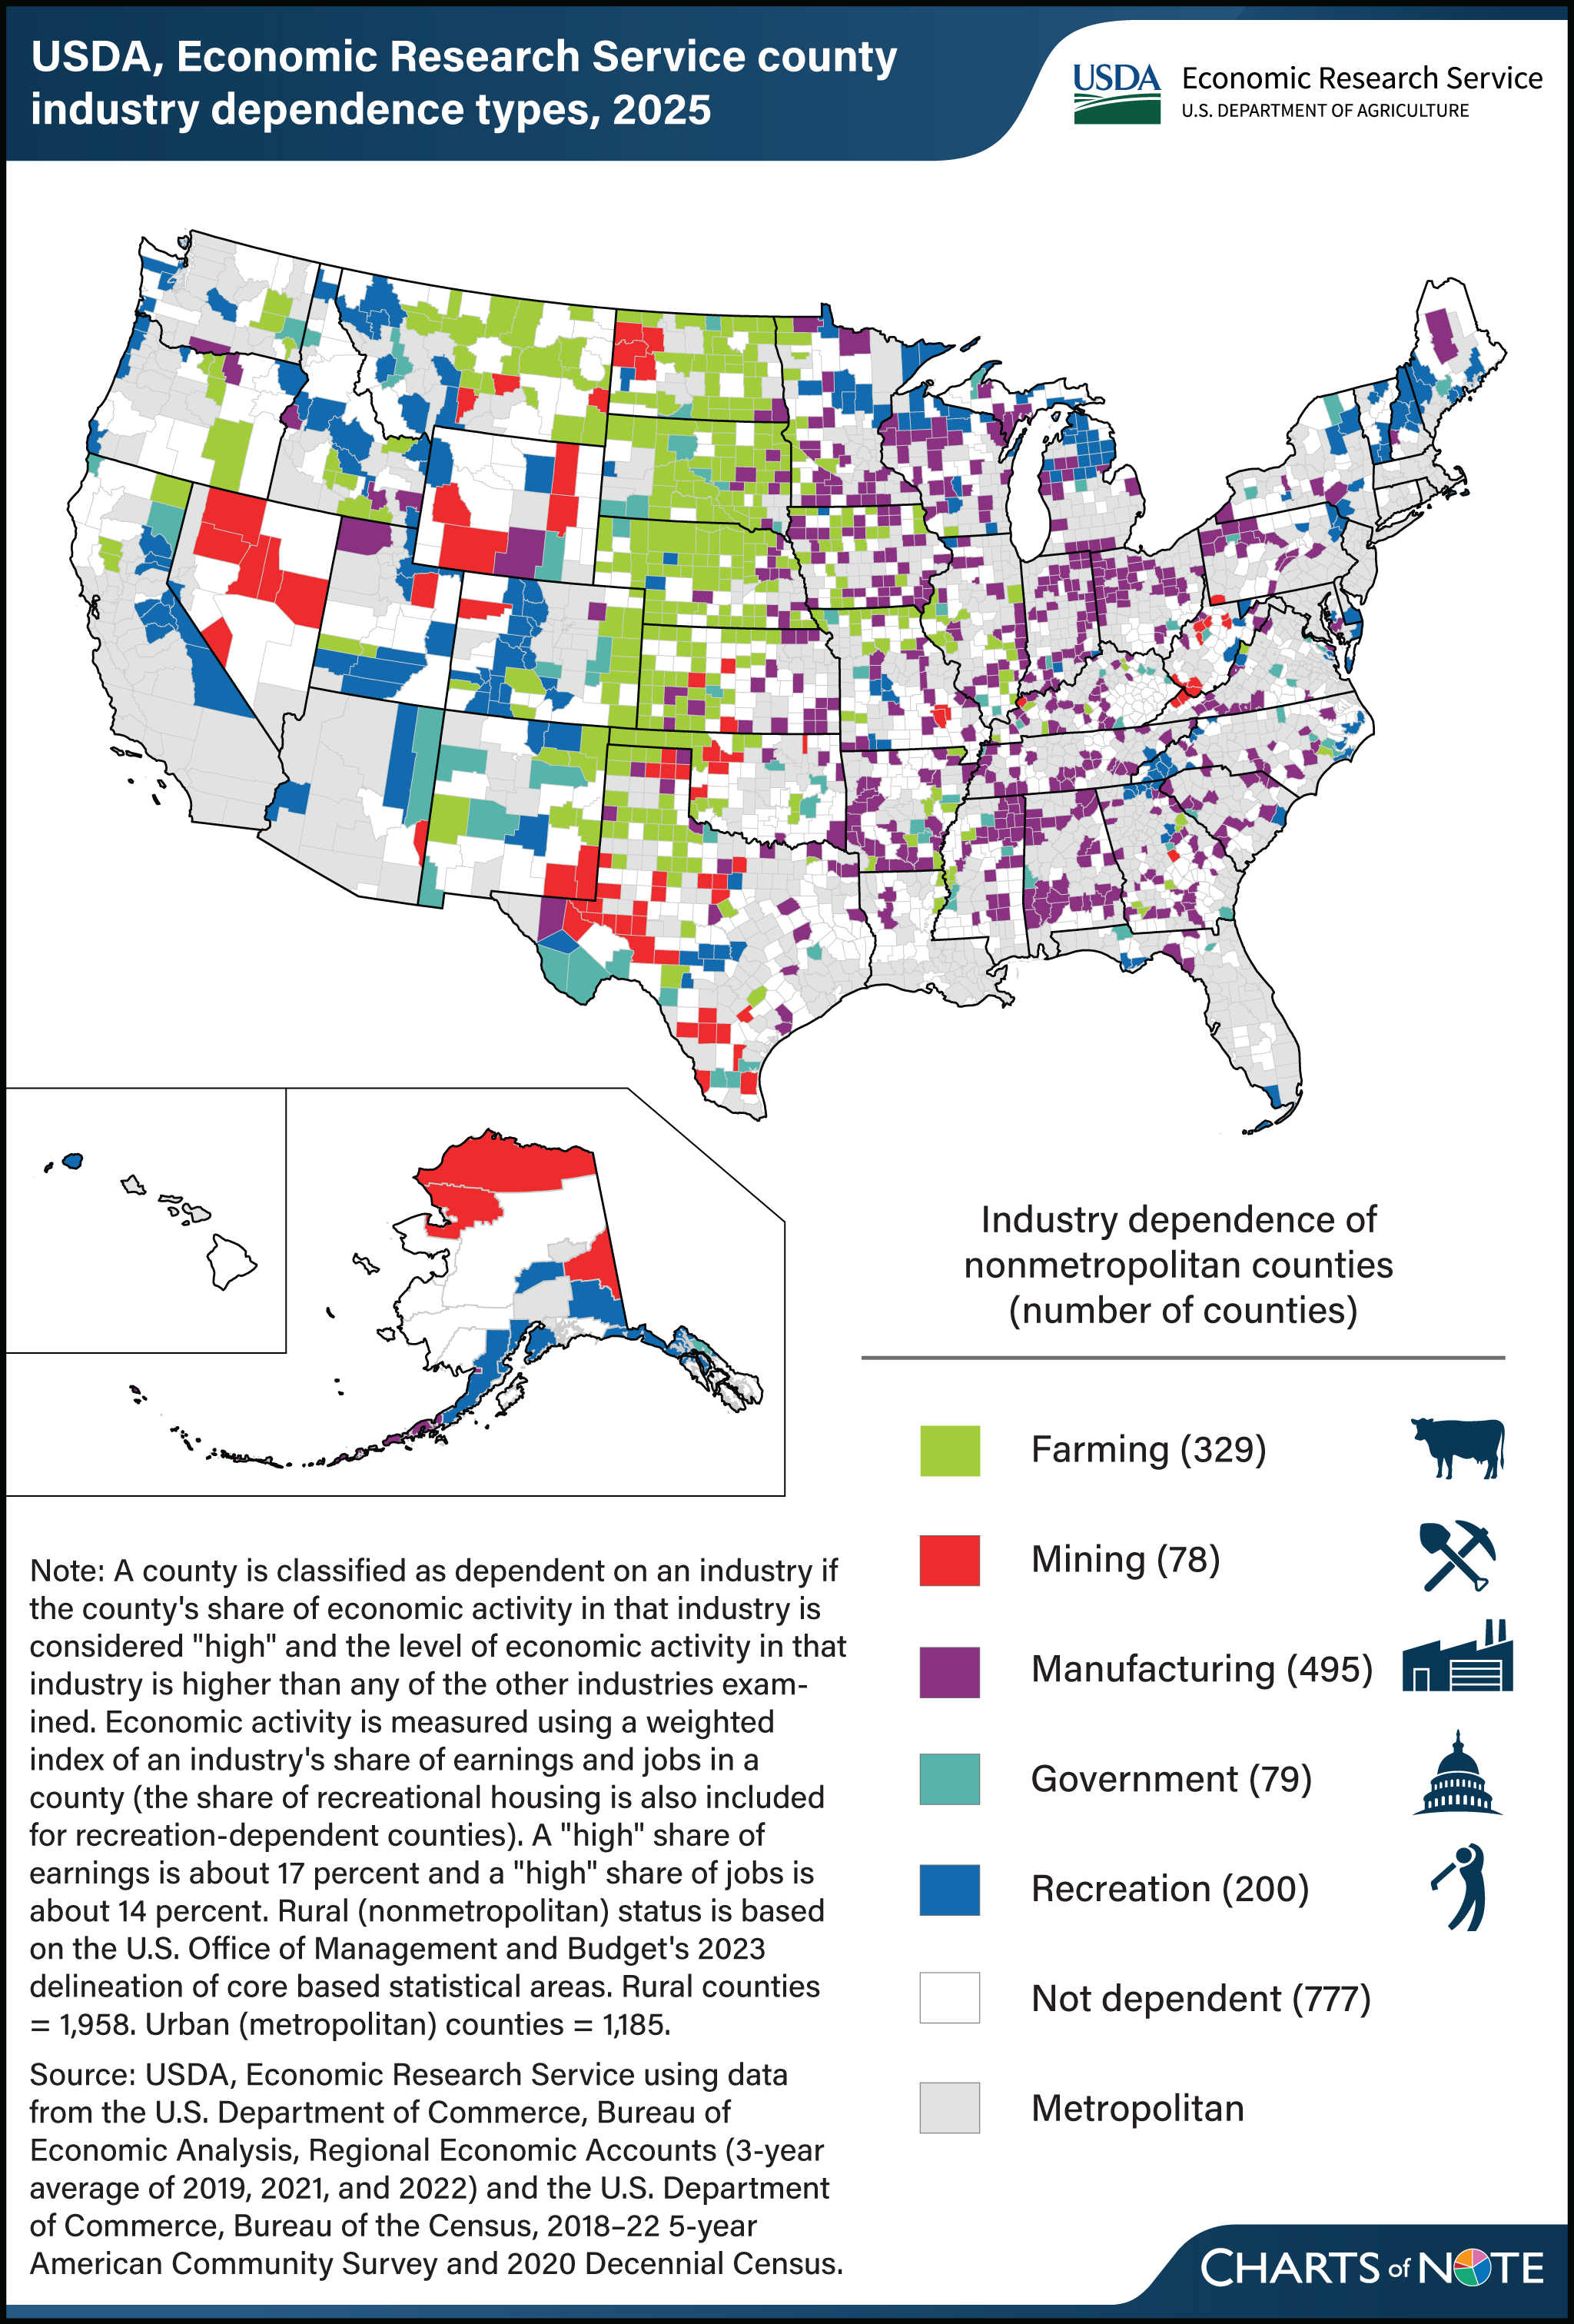
Rural U.S. counties depend on various industries for employment, wages, and revenue, with about 25 percent dependent on manufacturing and 17 percent dependent on agriculture. Researchers with USDA, Economic Research Service (ERS) classified all rural U.S. counties into one of six categories based on each industry’s share of total earnings and jobs in the county (and recreational housing for recreation-dependent counties). Out of the 1,958 rural counties, manufacturing was dominant in 495, while farming led in 329. Additionally, recreation led in 200 counties, Federal and State government led in 79 counties, and mining led in 78 counties. In 777 rural counties, none of the industries examined were dominant. This figure appears in the ERS County Typology Codes data product, updated in April 2025.