
Tasty treats often have a seasonal sweet spot
- by Megan Sweitzer and Anne T. Byrne
- 4/15/2025
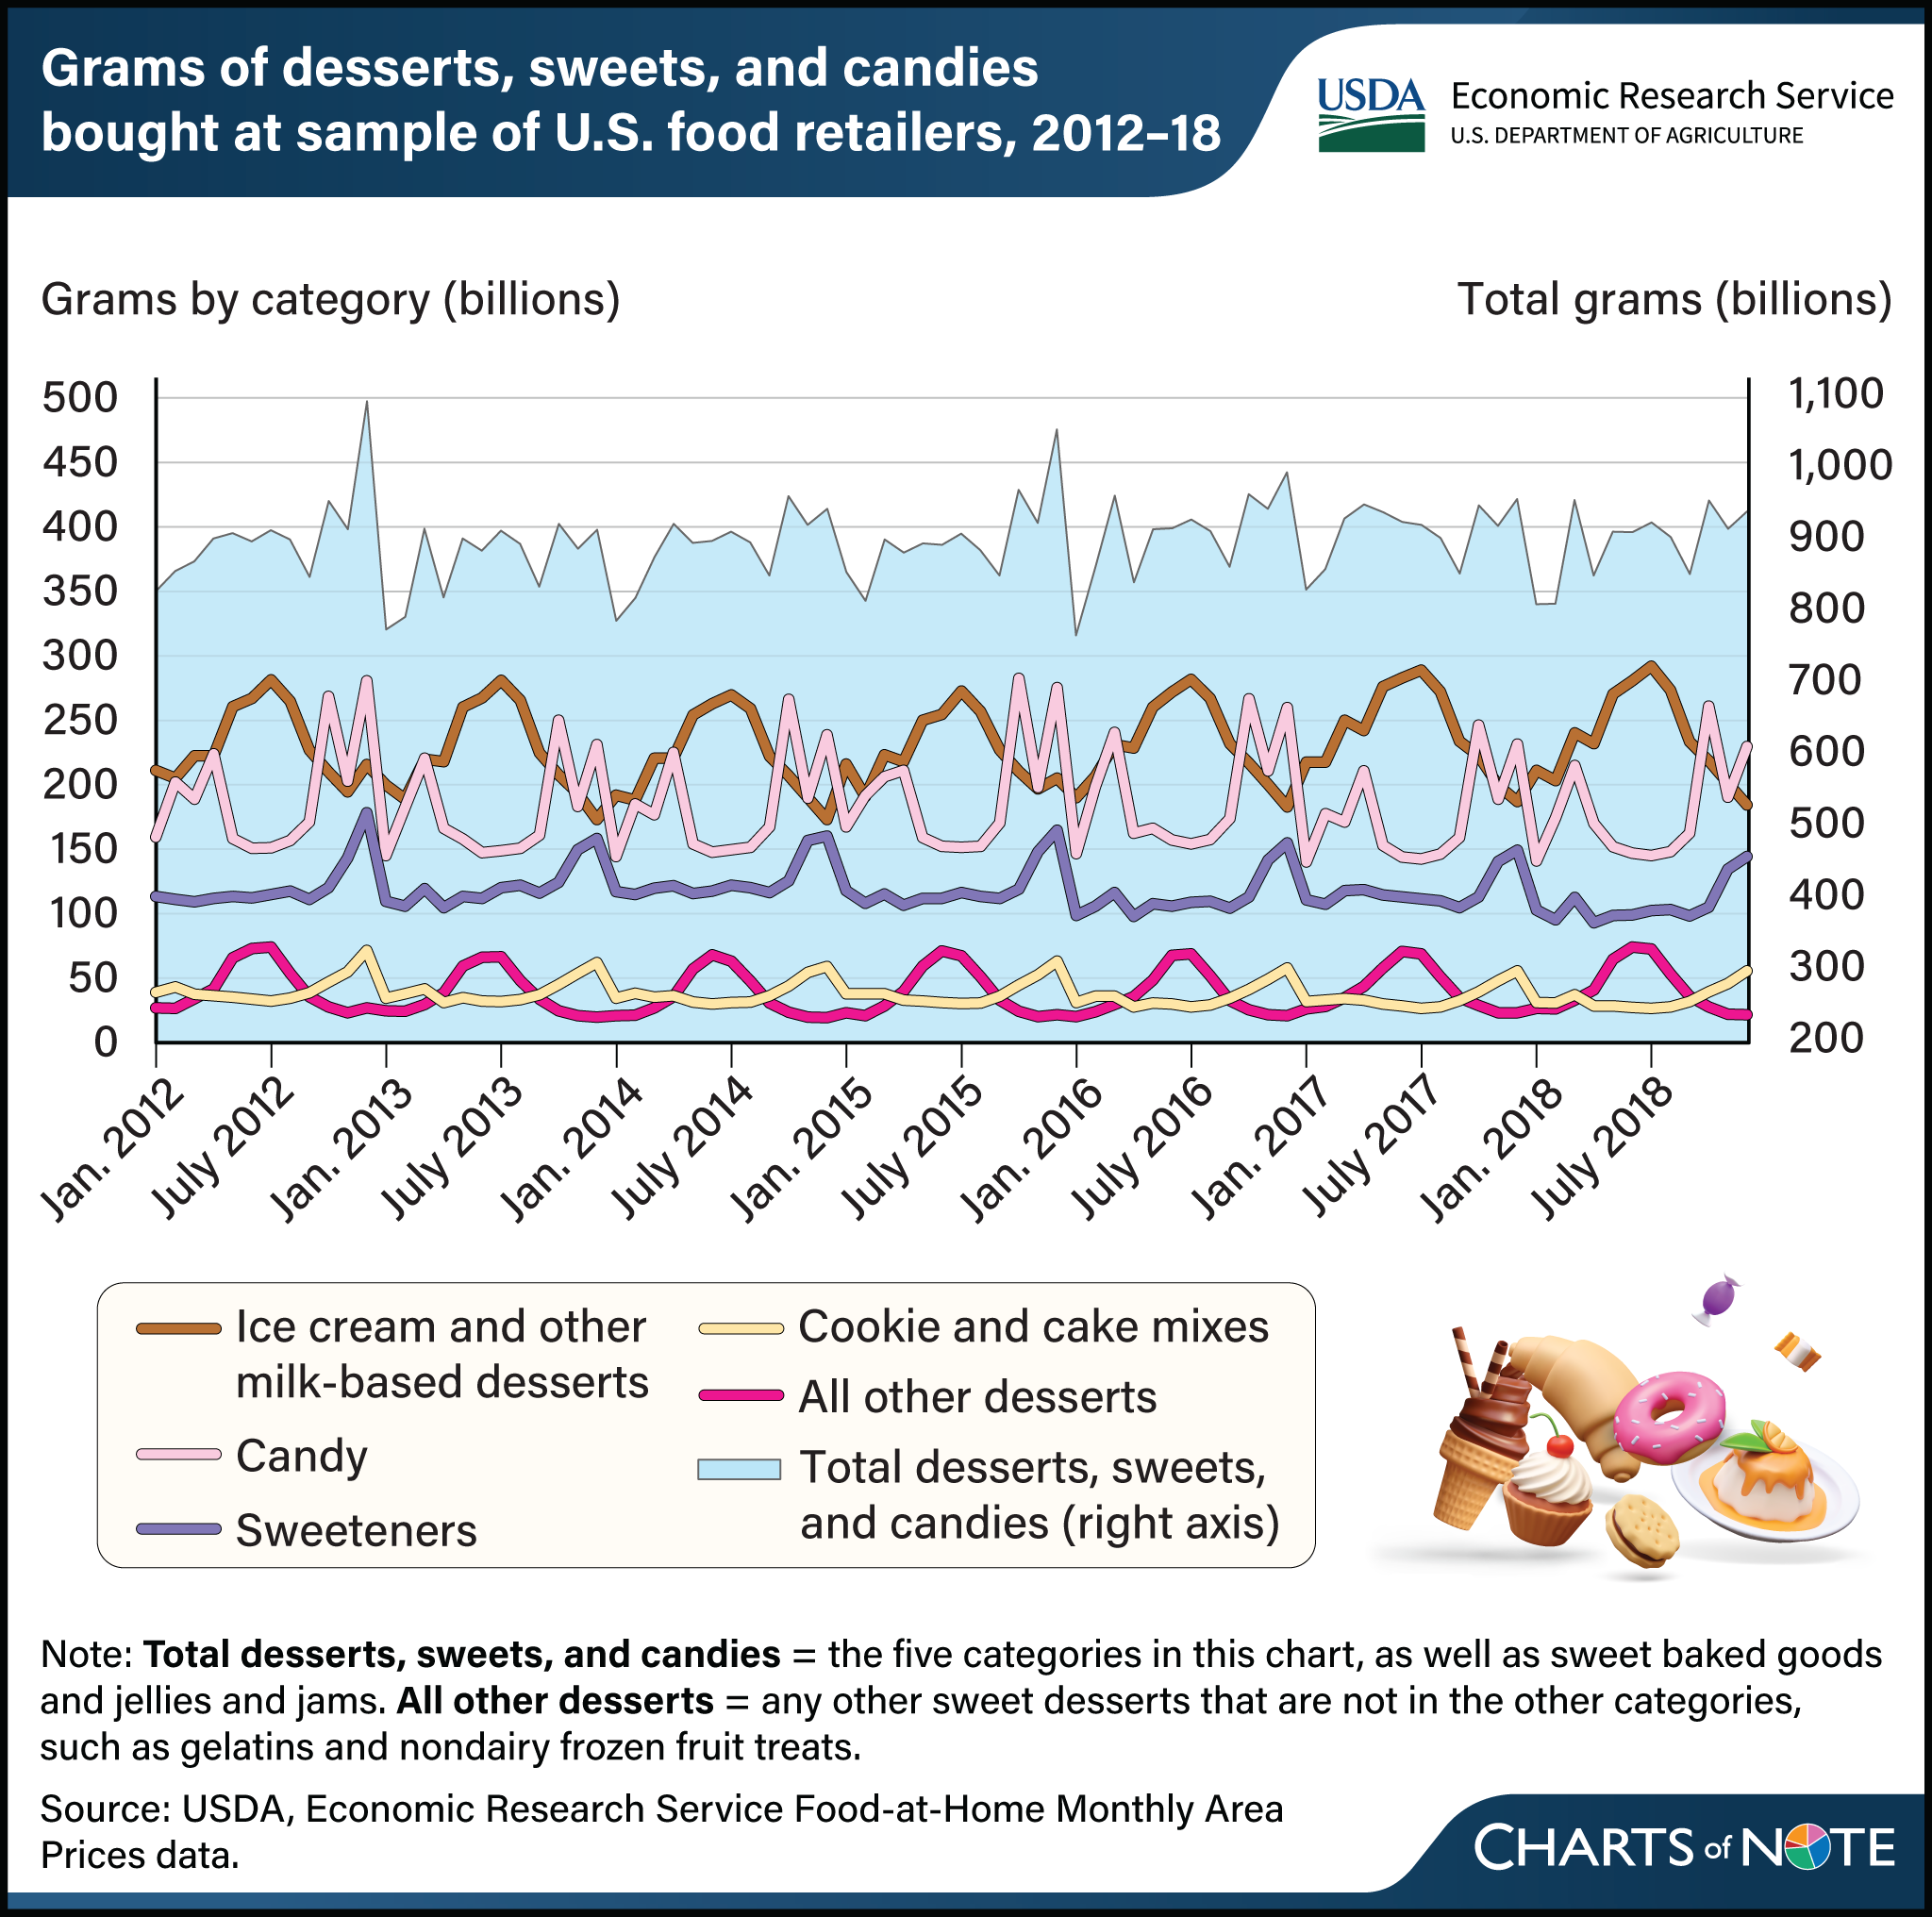
U.S. consumers are sweet on sweets, but their preferences for products vary seasonally. Many consumers scoop up ice cream and other milk-based desserts during the summer, as well as buy more of other types of desserts, such as nondairy frozen fruit treats and gelatins. Candy purchases measured in grams are highest in October and December but also hop around Easter in March and April. Purchases of sweeteners such as sugar and cookie and cake mixes rise in November and December during the holiday baking season. Total purchases of desserts, sweets, and candy were highest from October through December of most years and were lowest in January each year. This chart is drawn from the USDA, Economic Research Service’s (ERS) Food-at-Home Monthly Area Prices (F-MAP) data product. More information is available in the ERS Amber Waves article Using Food-at-Home Monthly Area Prices Data To Track Food Prices Over Time and Across Areas, published September 2024.
We’d welcome your feedback!
Would you be willing to answer a few quick questions about your experience?