
Number of U.S. farms continues slow decline
- by Andrew Keller and Kathleen Kassel
- 4/9/2025
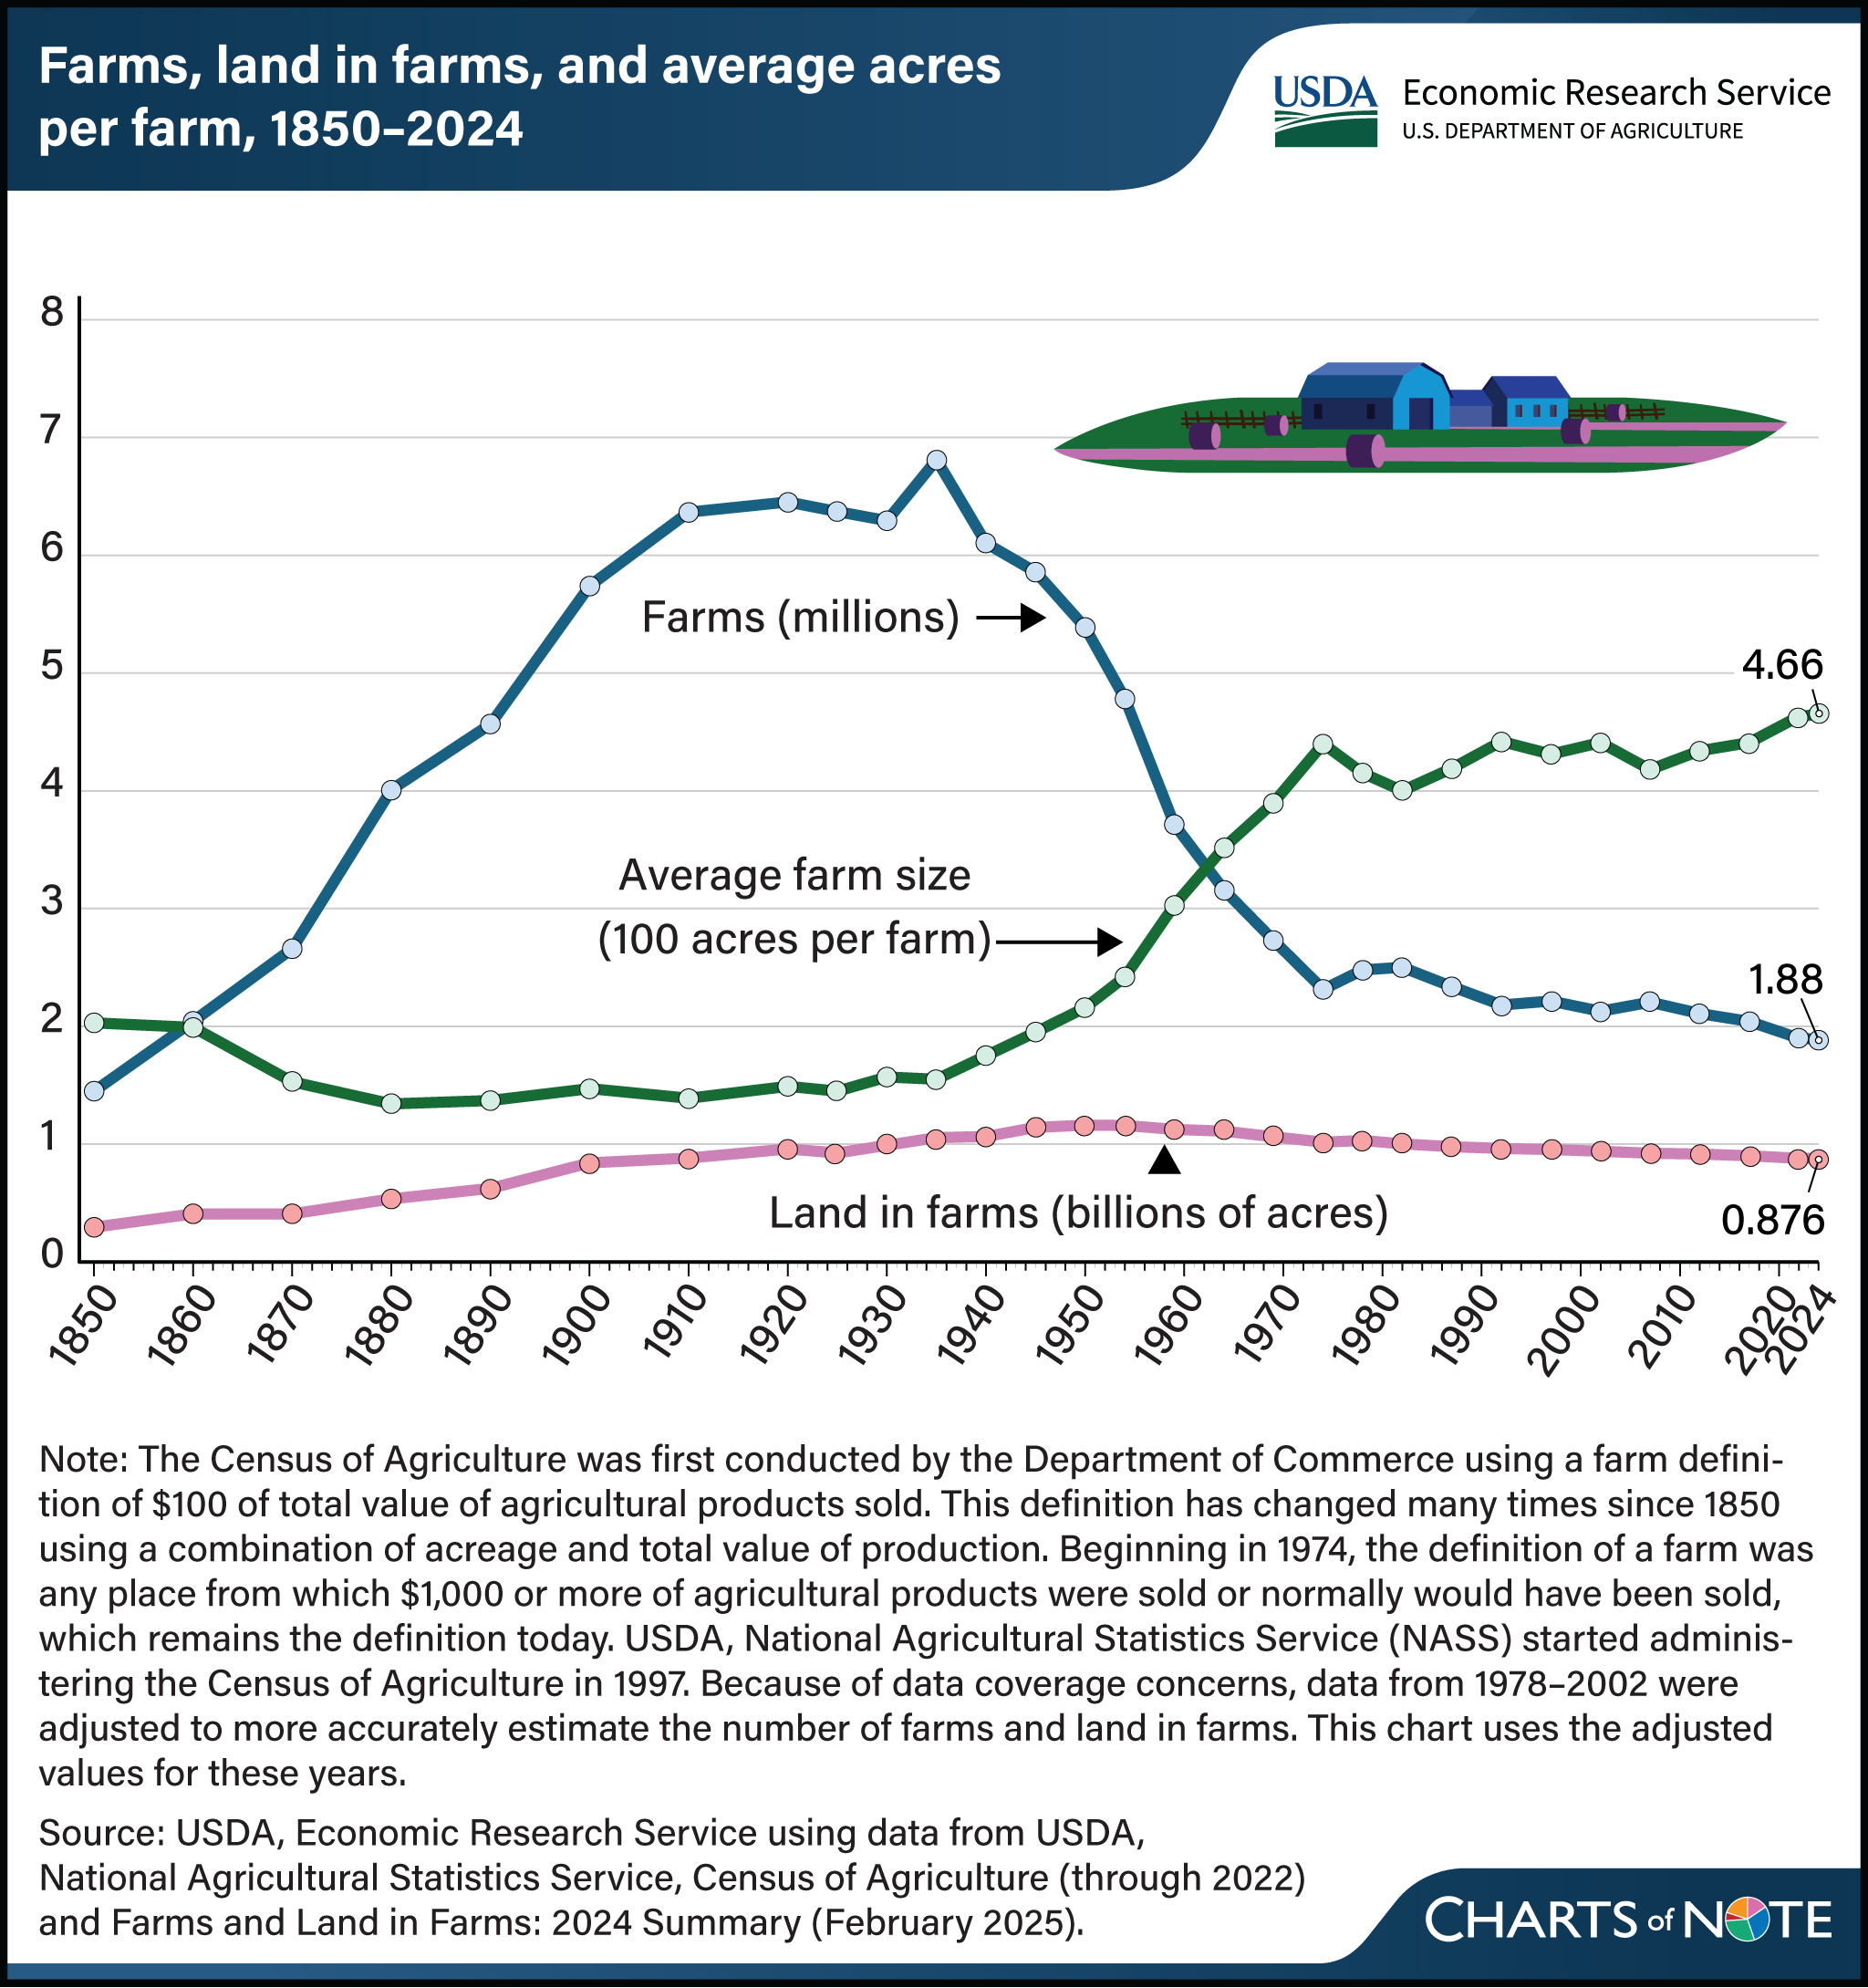
The number of farms in the United States continued its yearslong decline in 2024, reaching 1.88 million, the lowest in more than a century. After peaking at 6.81 million farms in 1935, the number of U.S. farms dropped sharply through the early 1970s and then began a slower decline. The most recent data show the number of U.S. farms in 2024 was down about 1 percent from the 1.90 million reported in USDA’s 2022 Census of Agriculture and 8 percent from the 2.04 million in the 2017 census. Similarly, acres of land in farms decreased to 876 million acres in 2024 from 880 million in 2022 and 900 million in 2017. The average farm size was 466 acres in 2024, slightly above 2022 and about 6 percent greater than the 440 acres recorded in the early 1970s. This chart appears in the USDA, Economic Research Service’s series Charting the Essentials, published in March 2025.