
Fruit juice intake dropped, driving decline in total U.S. fruit consumption
- by Sabrina Young
- 3/10/2025
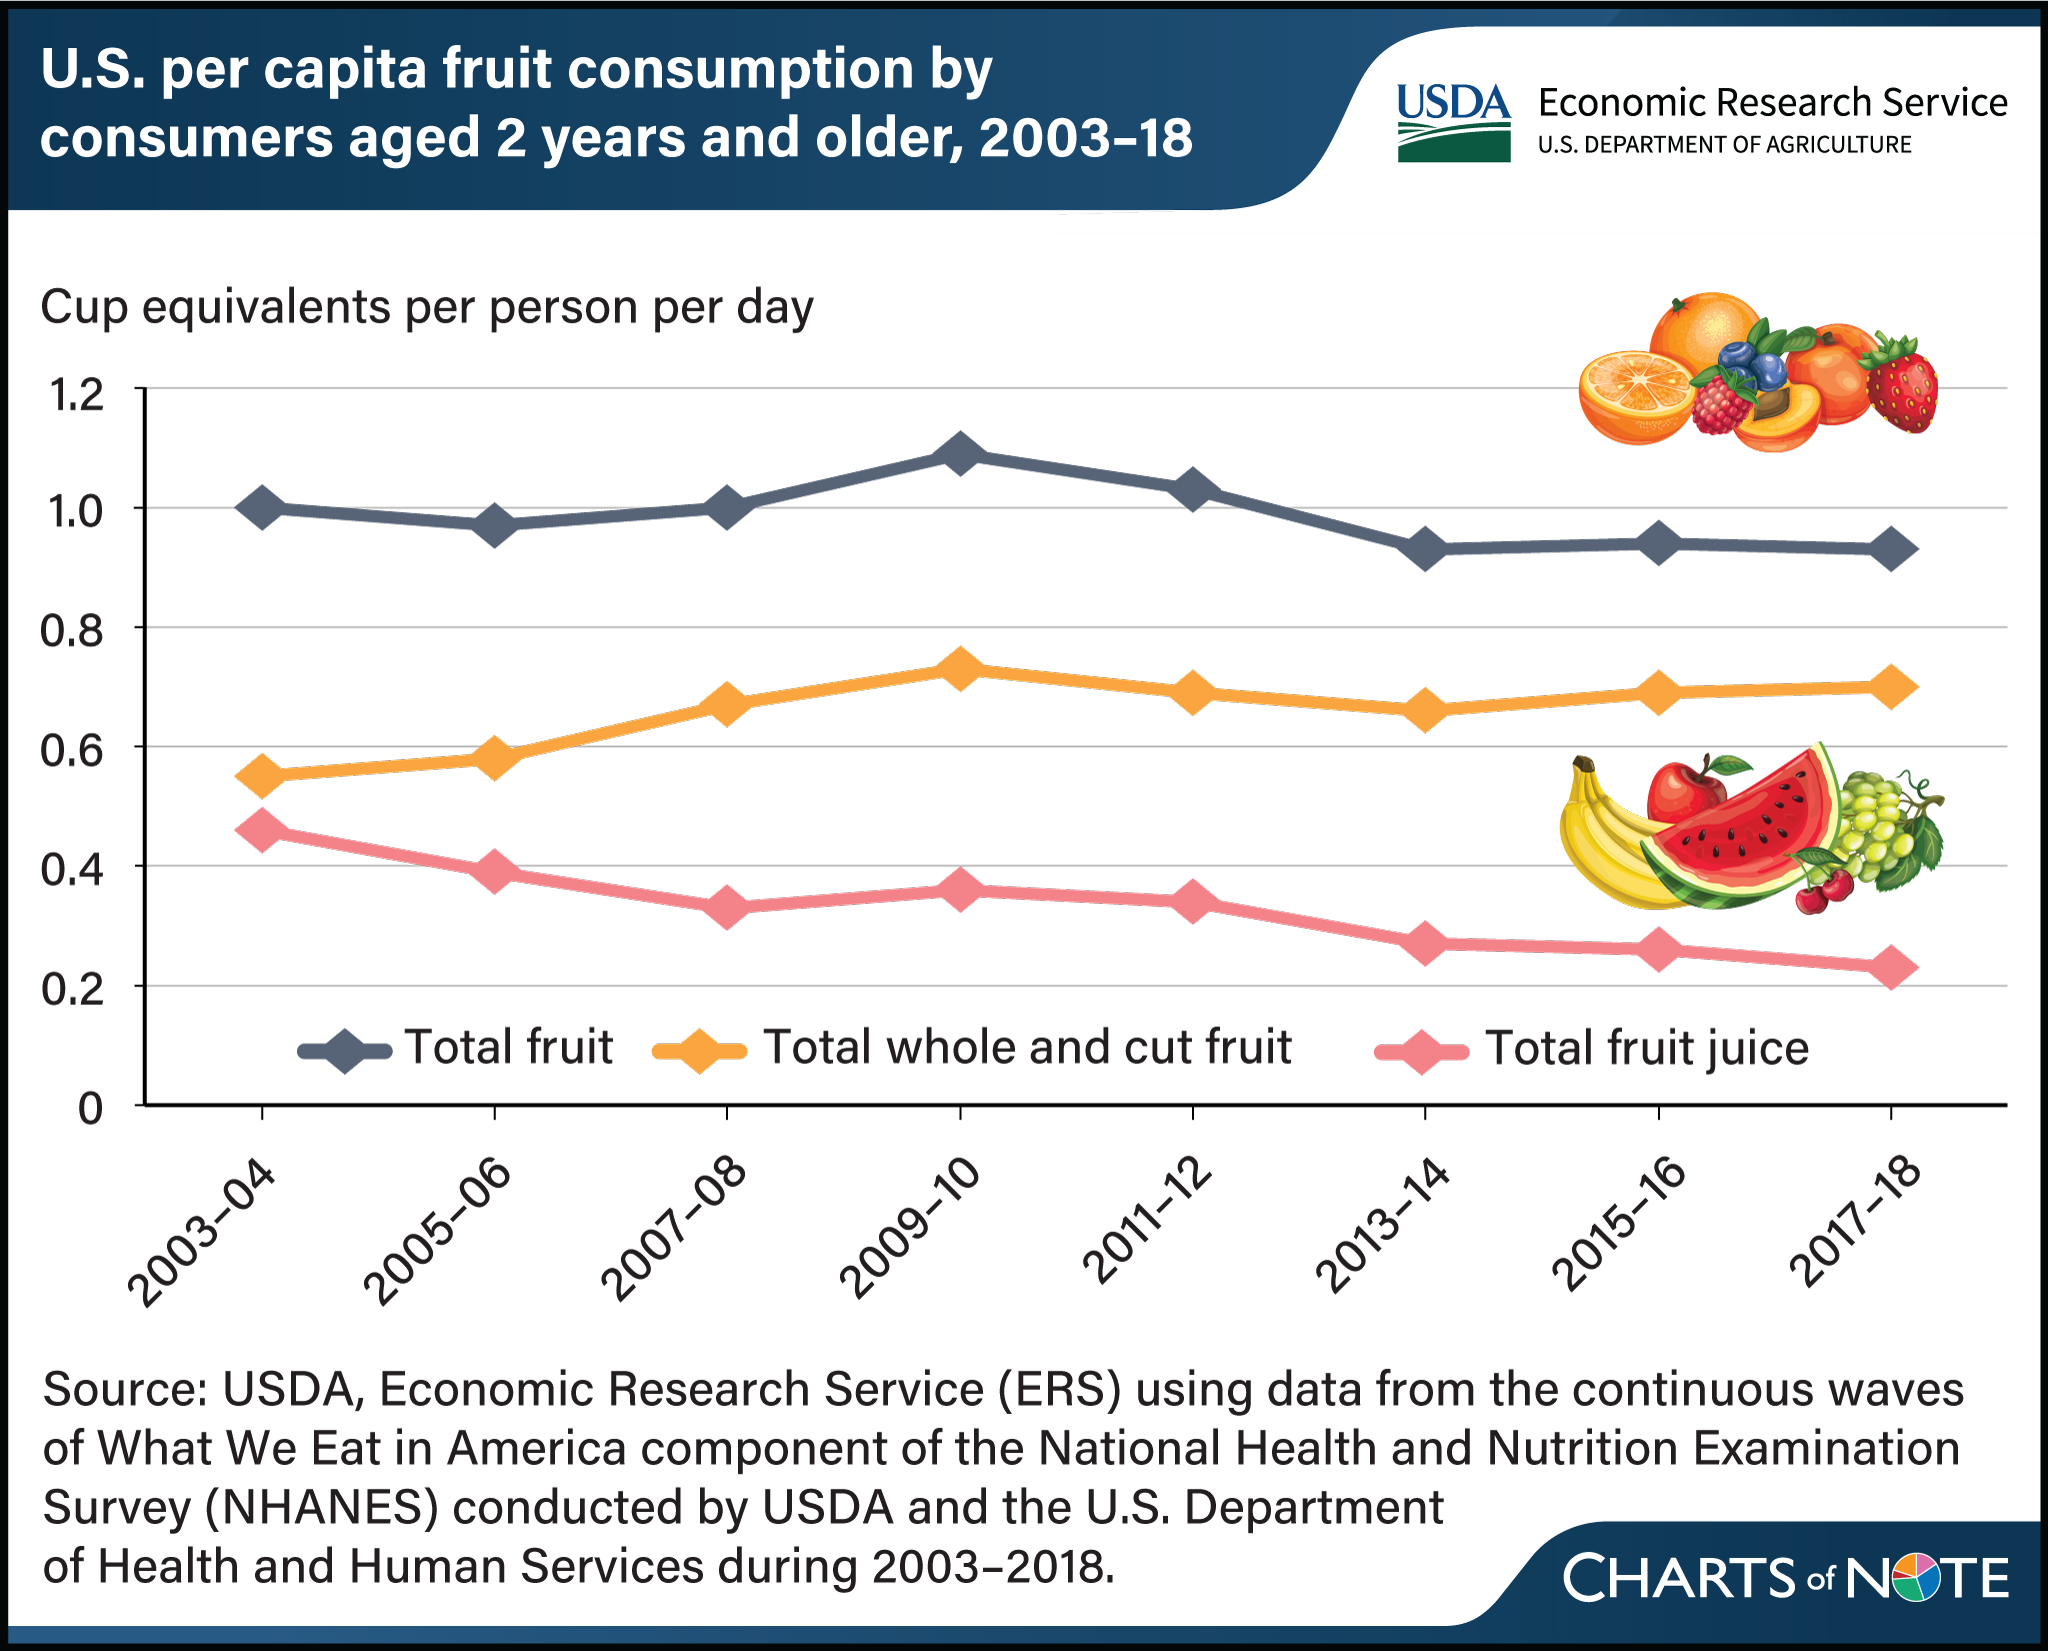
Total U.S. fruit intake declined 7 percent to 0.93 cup equivalent per person per day in 2017–18 from 1 cup equivalent in 2003–04. A 50-percent drop in fruit juice intake, from 0.46 cup equivalent per person per day in 2003–04 to 0.23 cup equivalent in 2017-18, drove the overall decrease in fruit consumption. For a nutritionally adequate diet, the Dietary Guidelines for Americans 2020–2025 advises individuals to consume about one cup equivalent of fruit for every 1,000 calories, with some variations for children and adolescents based on sex and physical activity. Fruit is a rich source of nutrients, including dietary fiber, potassium, calcium, and vitamin D. Given the importance of this food group to diet quality, the USDA, Economic Research Service (ERS) recently examined U.S. fruit consumption patterns and trends. These data come from the National Health and Nutrition Examination Survey (NHANES), which nutritionists use to study diet quality. This chart appears in the ERS Amber Waves article Peeling Open U.S. Fruit Consumption Trends, published February 2025.
We’d welcome your feedback!
Would you be willing to answer a few quick questions about your experience?