
As food price inflation slowed in 2024, inflation-adjusted food spending rebounded
- by Eliana Zeballos and Wilson Sinclair
- 2/24/2025
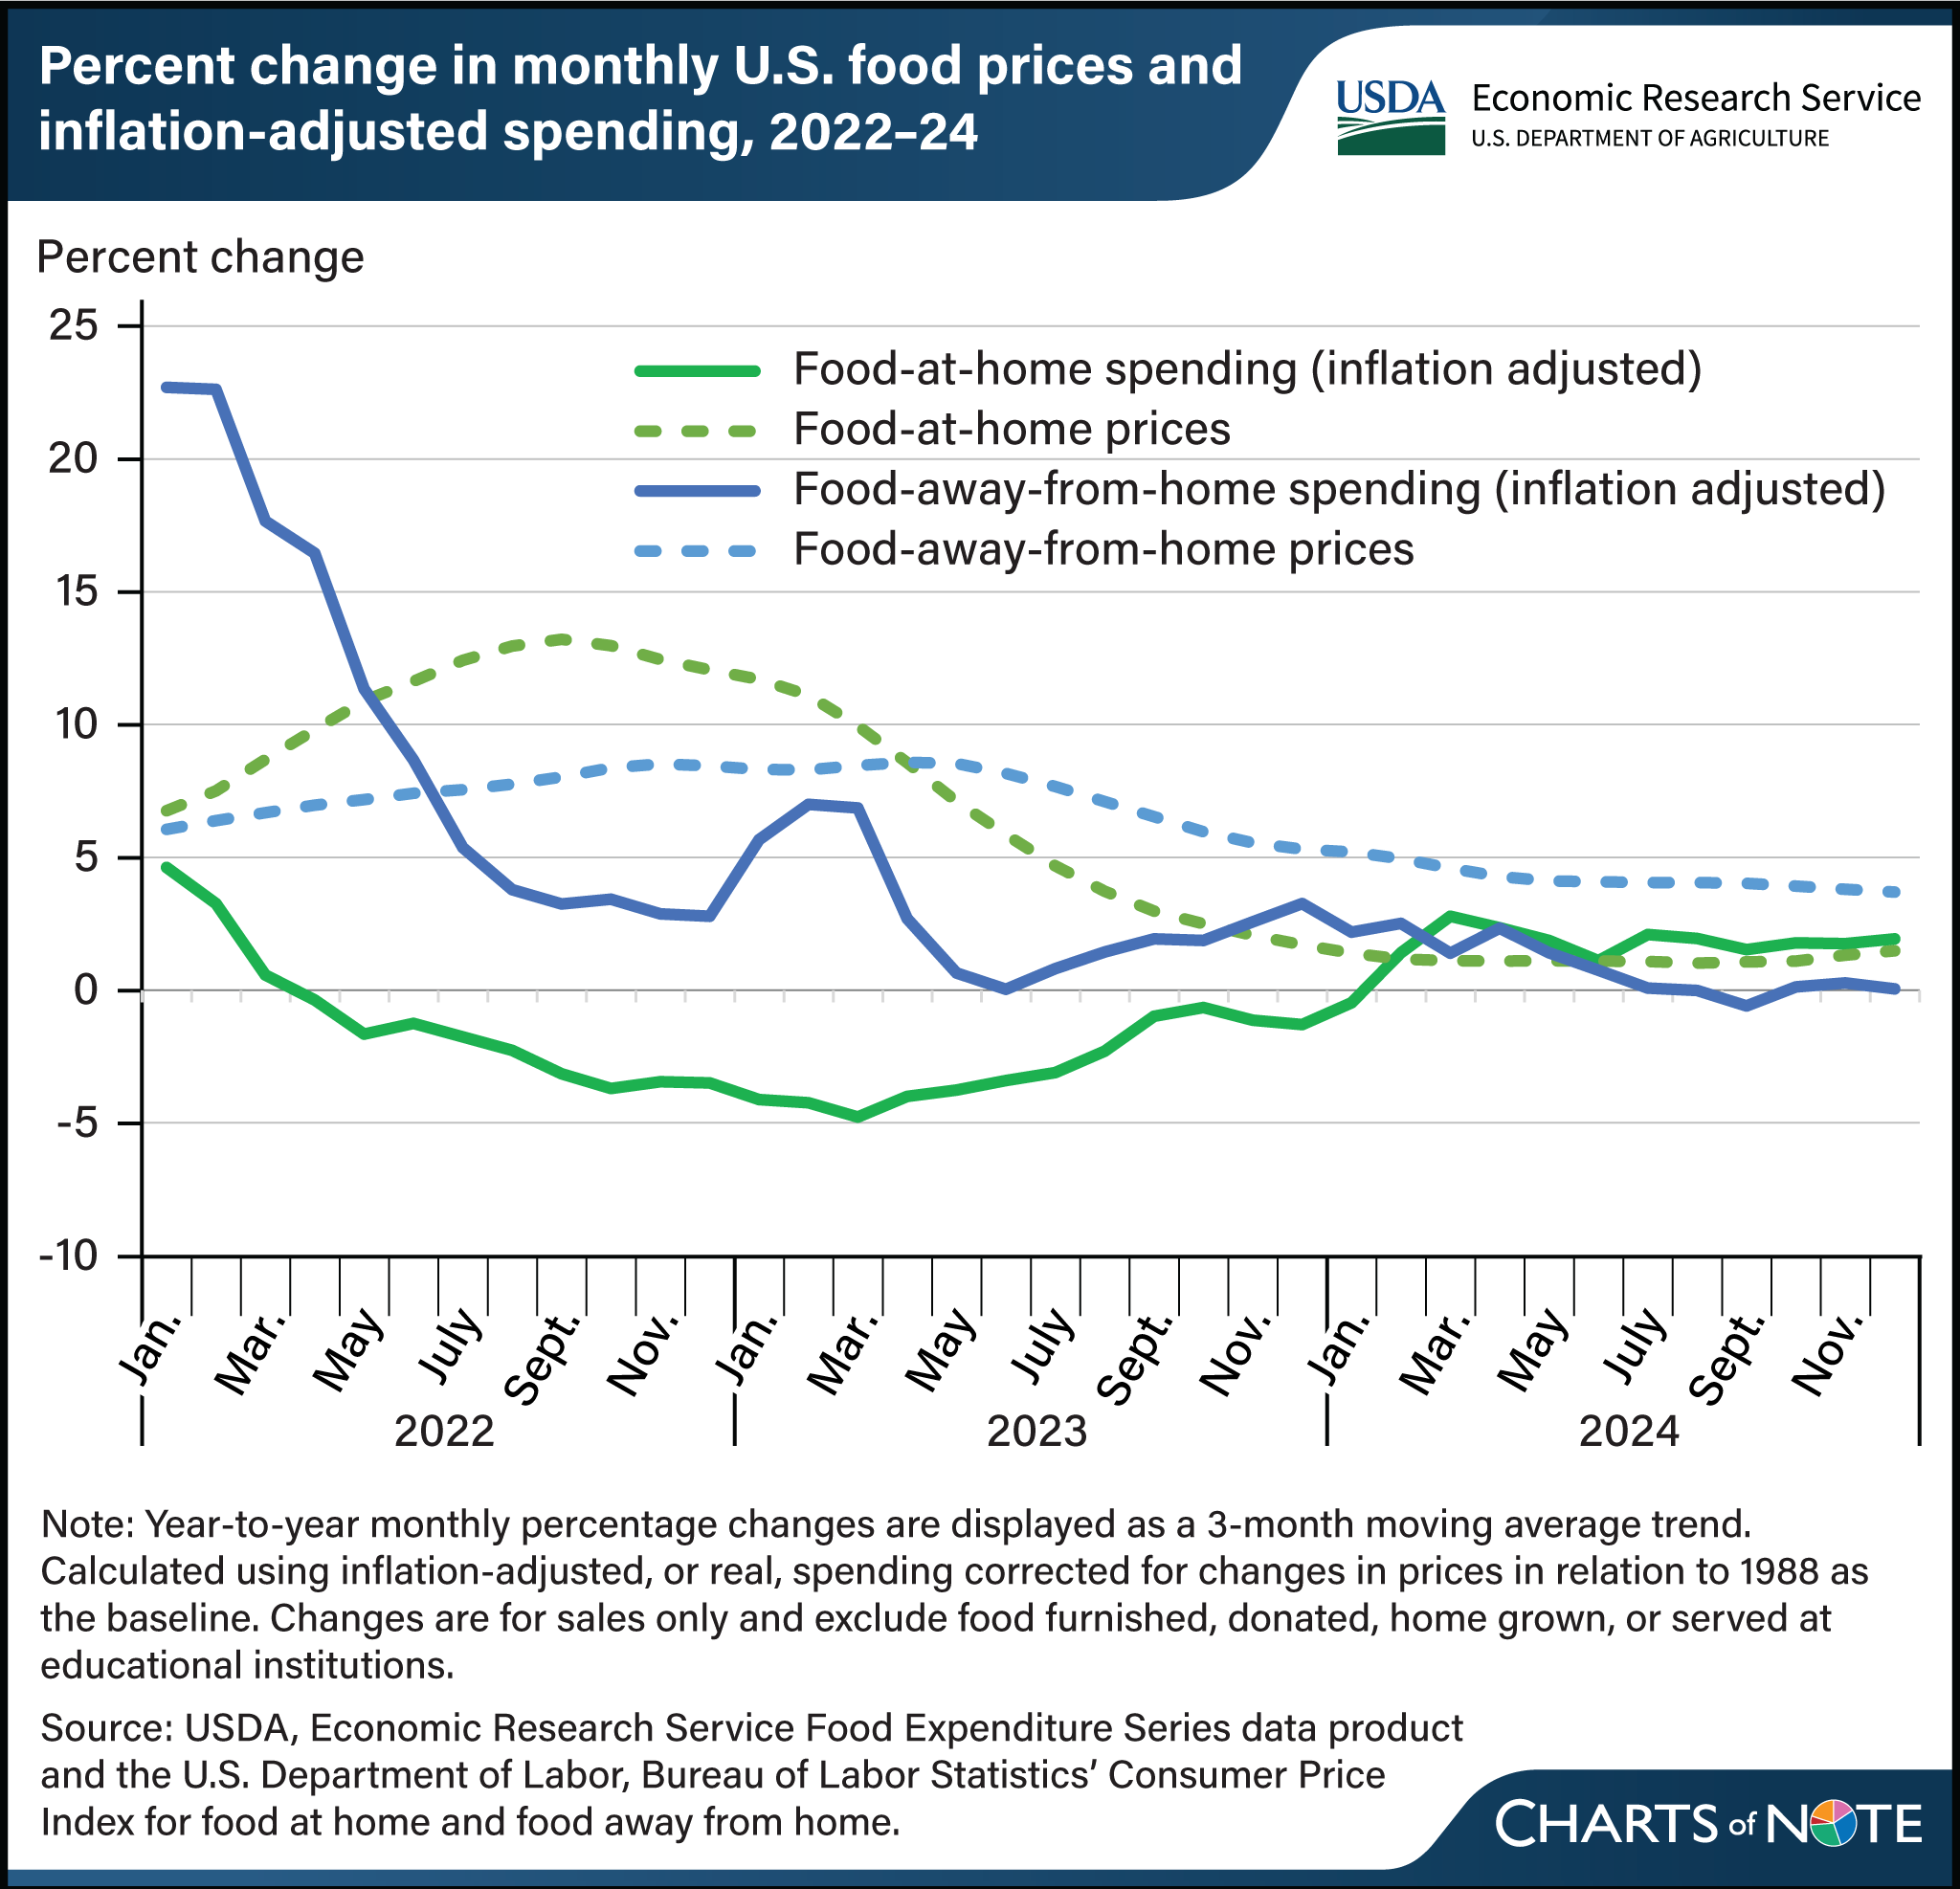
Food prices increased moderately in 2023 and 2024 compared with the elevated food price inflation of 2022. Average food-at-home prices rose 5.1 percent in 2023 and 1.2 percent in 2024 compared with 11.4 percent in 2022, while food-away-from-home prices increased 7.1 percent in 2023 and 4.1 percent in 2024, compared with 7.6 in 2022. When adjusted for inflation, real spending on food reveals more nuanced trends. In 2024, real food-at-home spending rebounded with a 1.8-percent increase after a 2.6-percent decline in 2023. This shows a stabilization in food-at-home consumption as inflation pressures eased. In contrast, real food-away-from-home spending grew by 3.0 percent in 2023 but grew by only 0.4 percent in 2024. This indicates that while food-away-from-home spending continues to rise, it is doing so at a slower rate amid higher prices. As a basic necessity, food remains a significant component of household expenditures, and as prices rise, overall food spending tends to increase. However, the way households respond to higher food prices varies, influencing the degree of spending adjustments. For example, some consumers may buy less food overall, opt for lower-cost alternatives, or reduce food-away-from-home spending by cooking more at home. The willingness of consumers to allocate a larger share of their budgets to food-away-from-home options indicates a preference for convenience, social dining experiences, and the value placed on food services. This chart is drawn from USDA, Economic Research Service’s Food Expenditure Series, updated in February 2025.