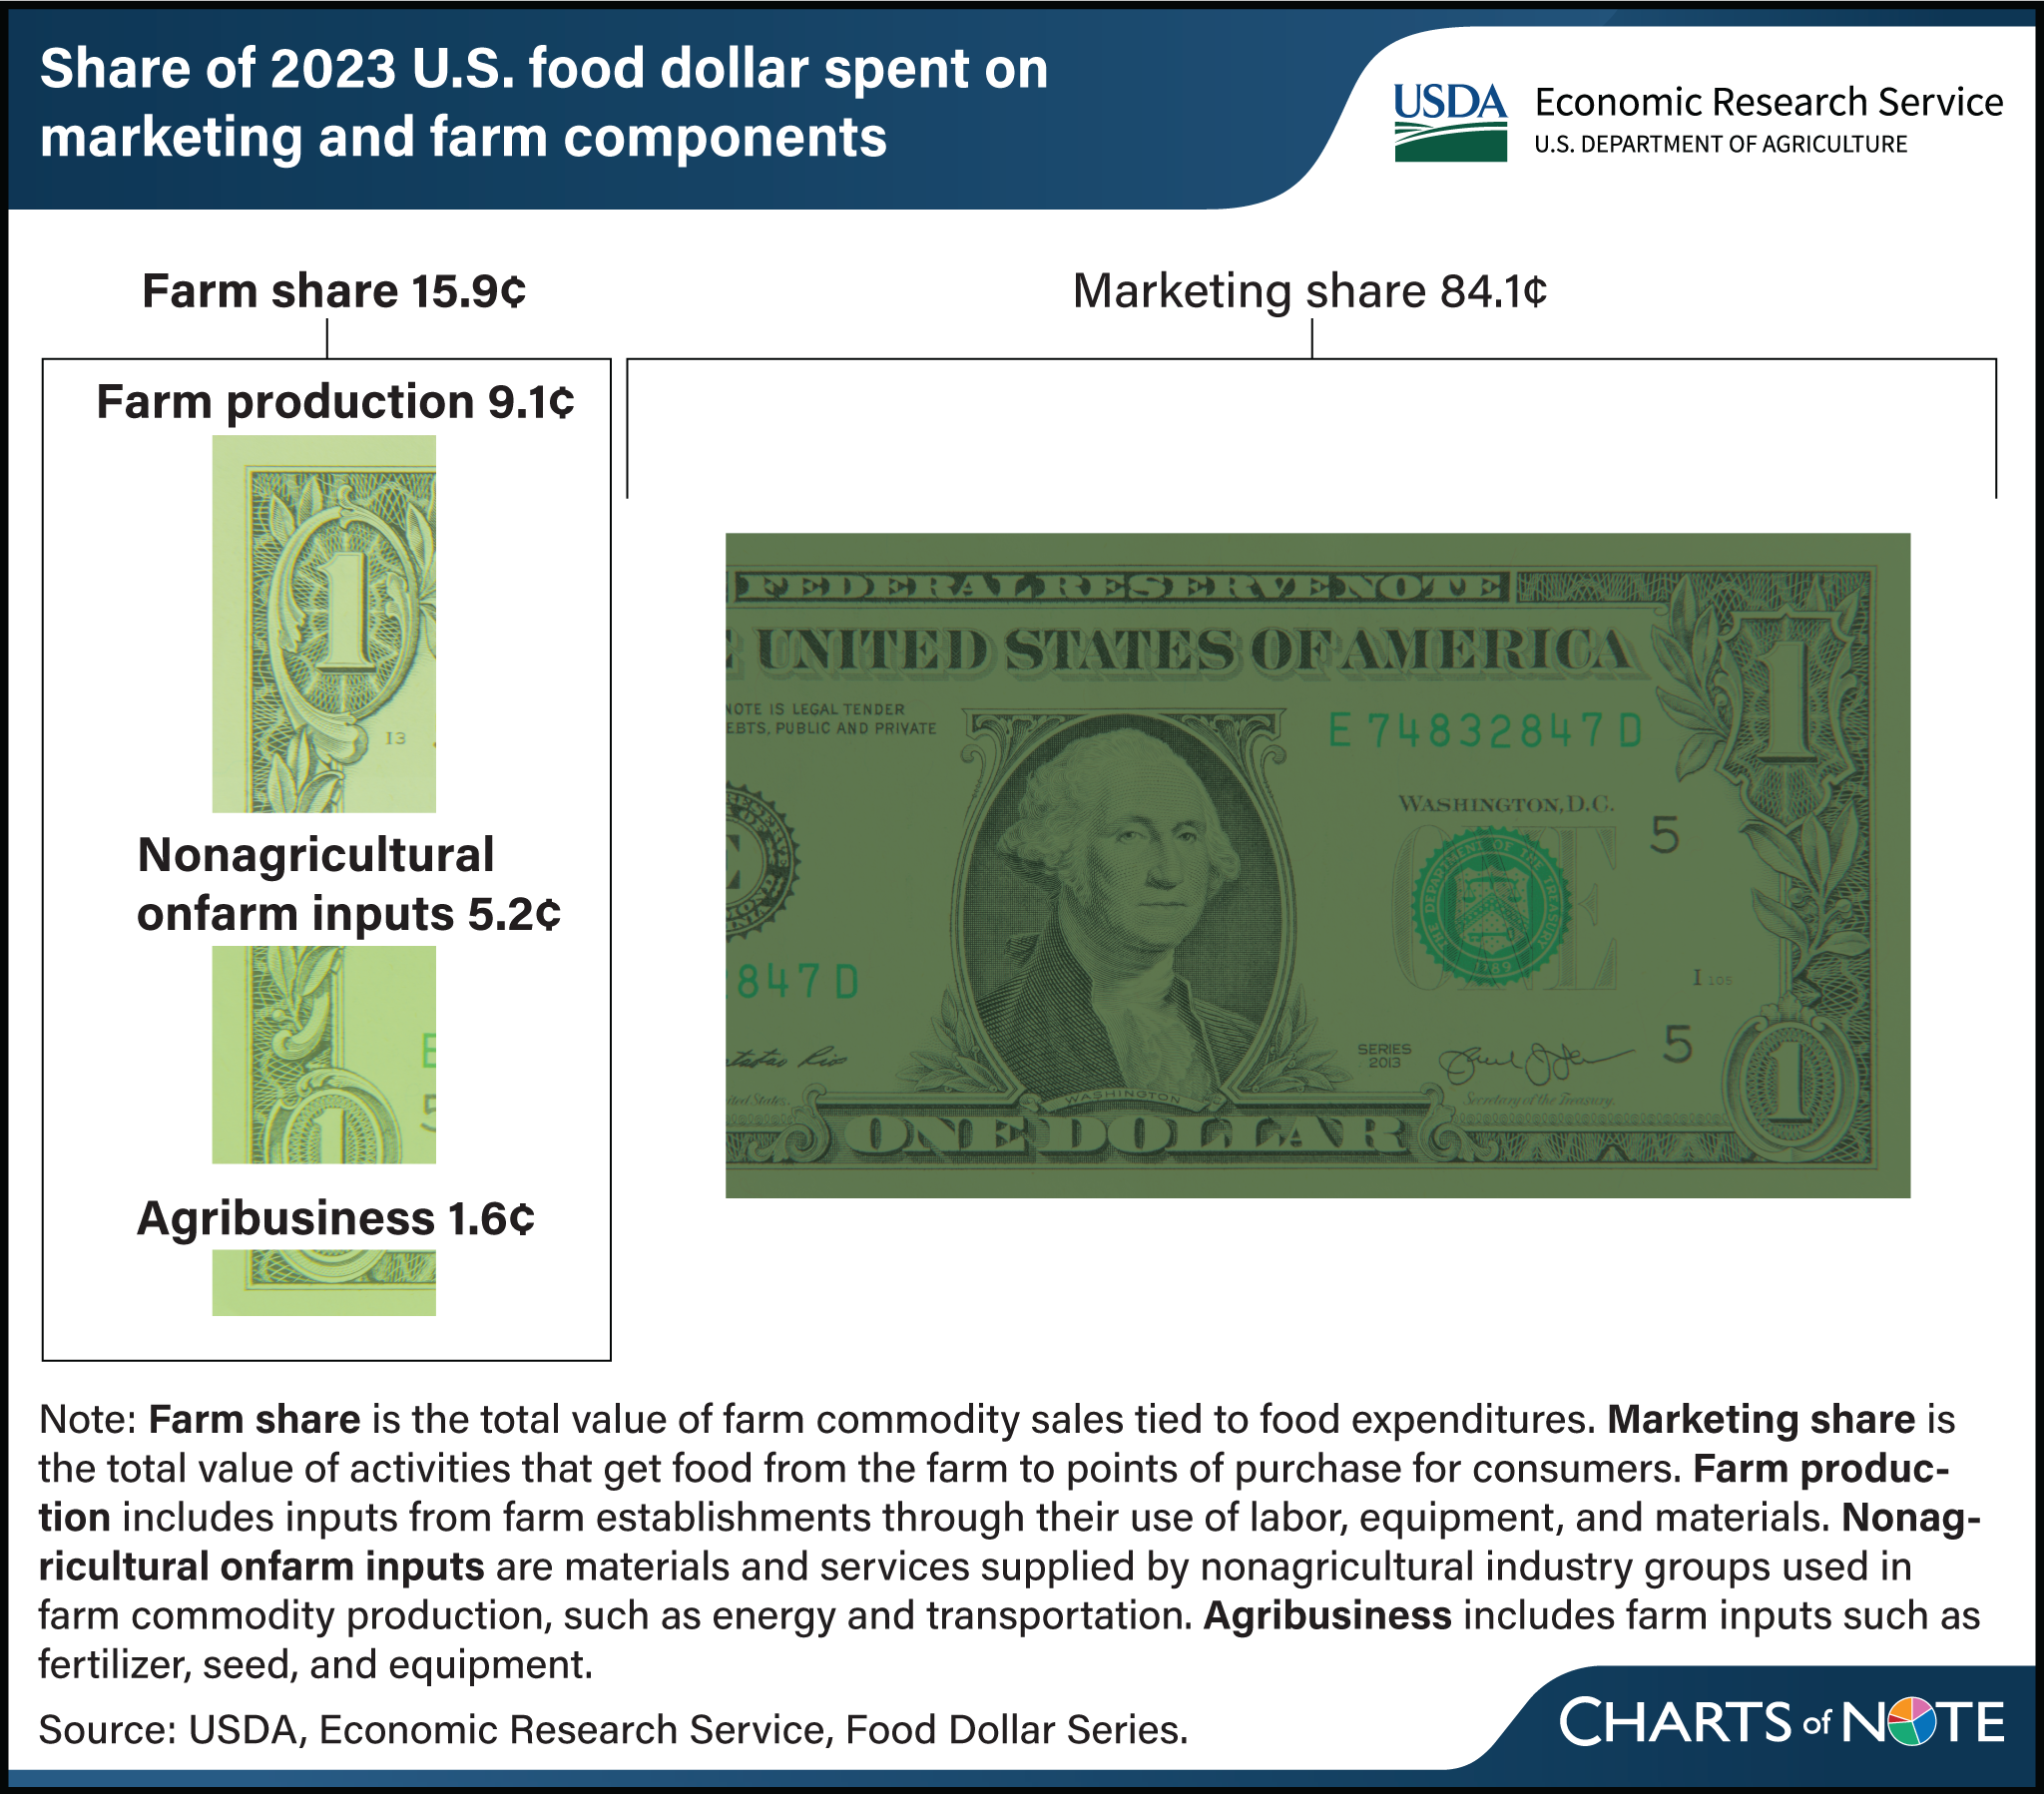
Almost a third of the farm share of the food dollar went to nonagricultural industries in 2023
- by James Chandler Zachary
- 1/15/2025

In 2023, farm establishments received 15.9 cents per dollar spent by consumers on domestically produced food for the sale of farm commodities. However, this amount, called the farm share, does not all remain on the farm. Farm commodity production requires many inputs from nonfarm establishments. Some inputs, such as fertilizer, seed, and equipment, are supplied by establishments in the agribusiness industry group. These inputs to farm commodity production cost 1.6 cents per dollar spent on food in 2023. Inputs from nonagricultural industry groups, such as energy and transportation, are also used on the farm and throughout the food supply chain. In 2023, the cost of these inputs at the farm level was 5.2 cents per dollar spent on food. The remaining 9.1 cents from the farm share are for farm production, which is equal to the value added by farm establishments through their use of labor, equipment, and materials. The remaining 84.1 cents per dollar spent on food in 2023 went to industries to get food to various points of purchase after it left the farm. This portion is called the marketing share. This chart updates information in the Amber Waves data feature ERS Food Dollar’s Three Series Show Distributions of U.S. Food Production Costs, published in December 2023.

