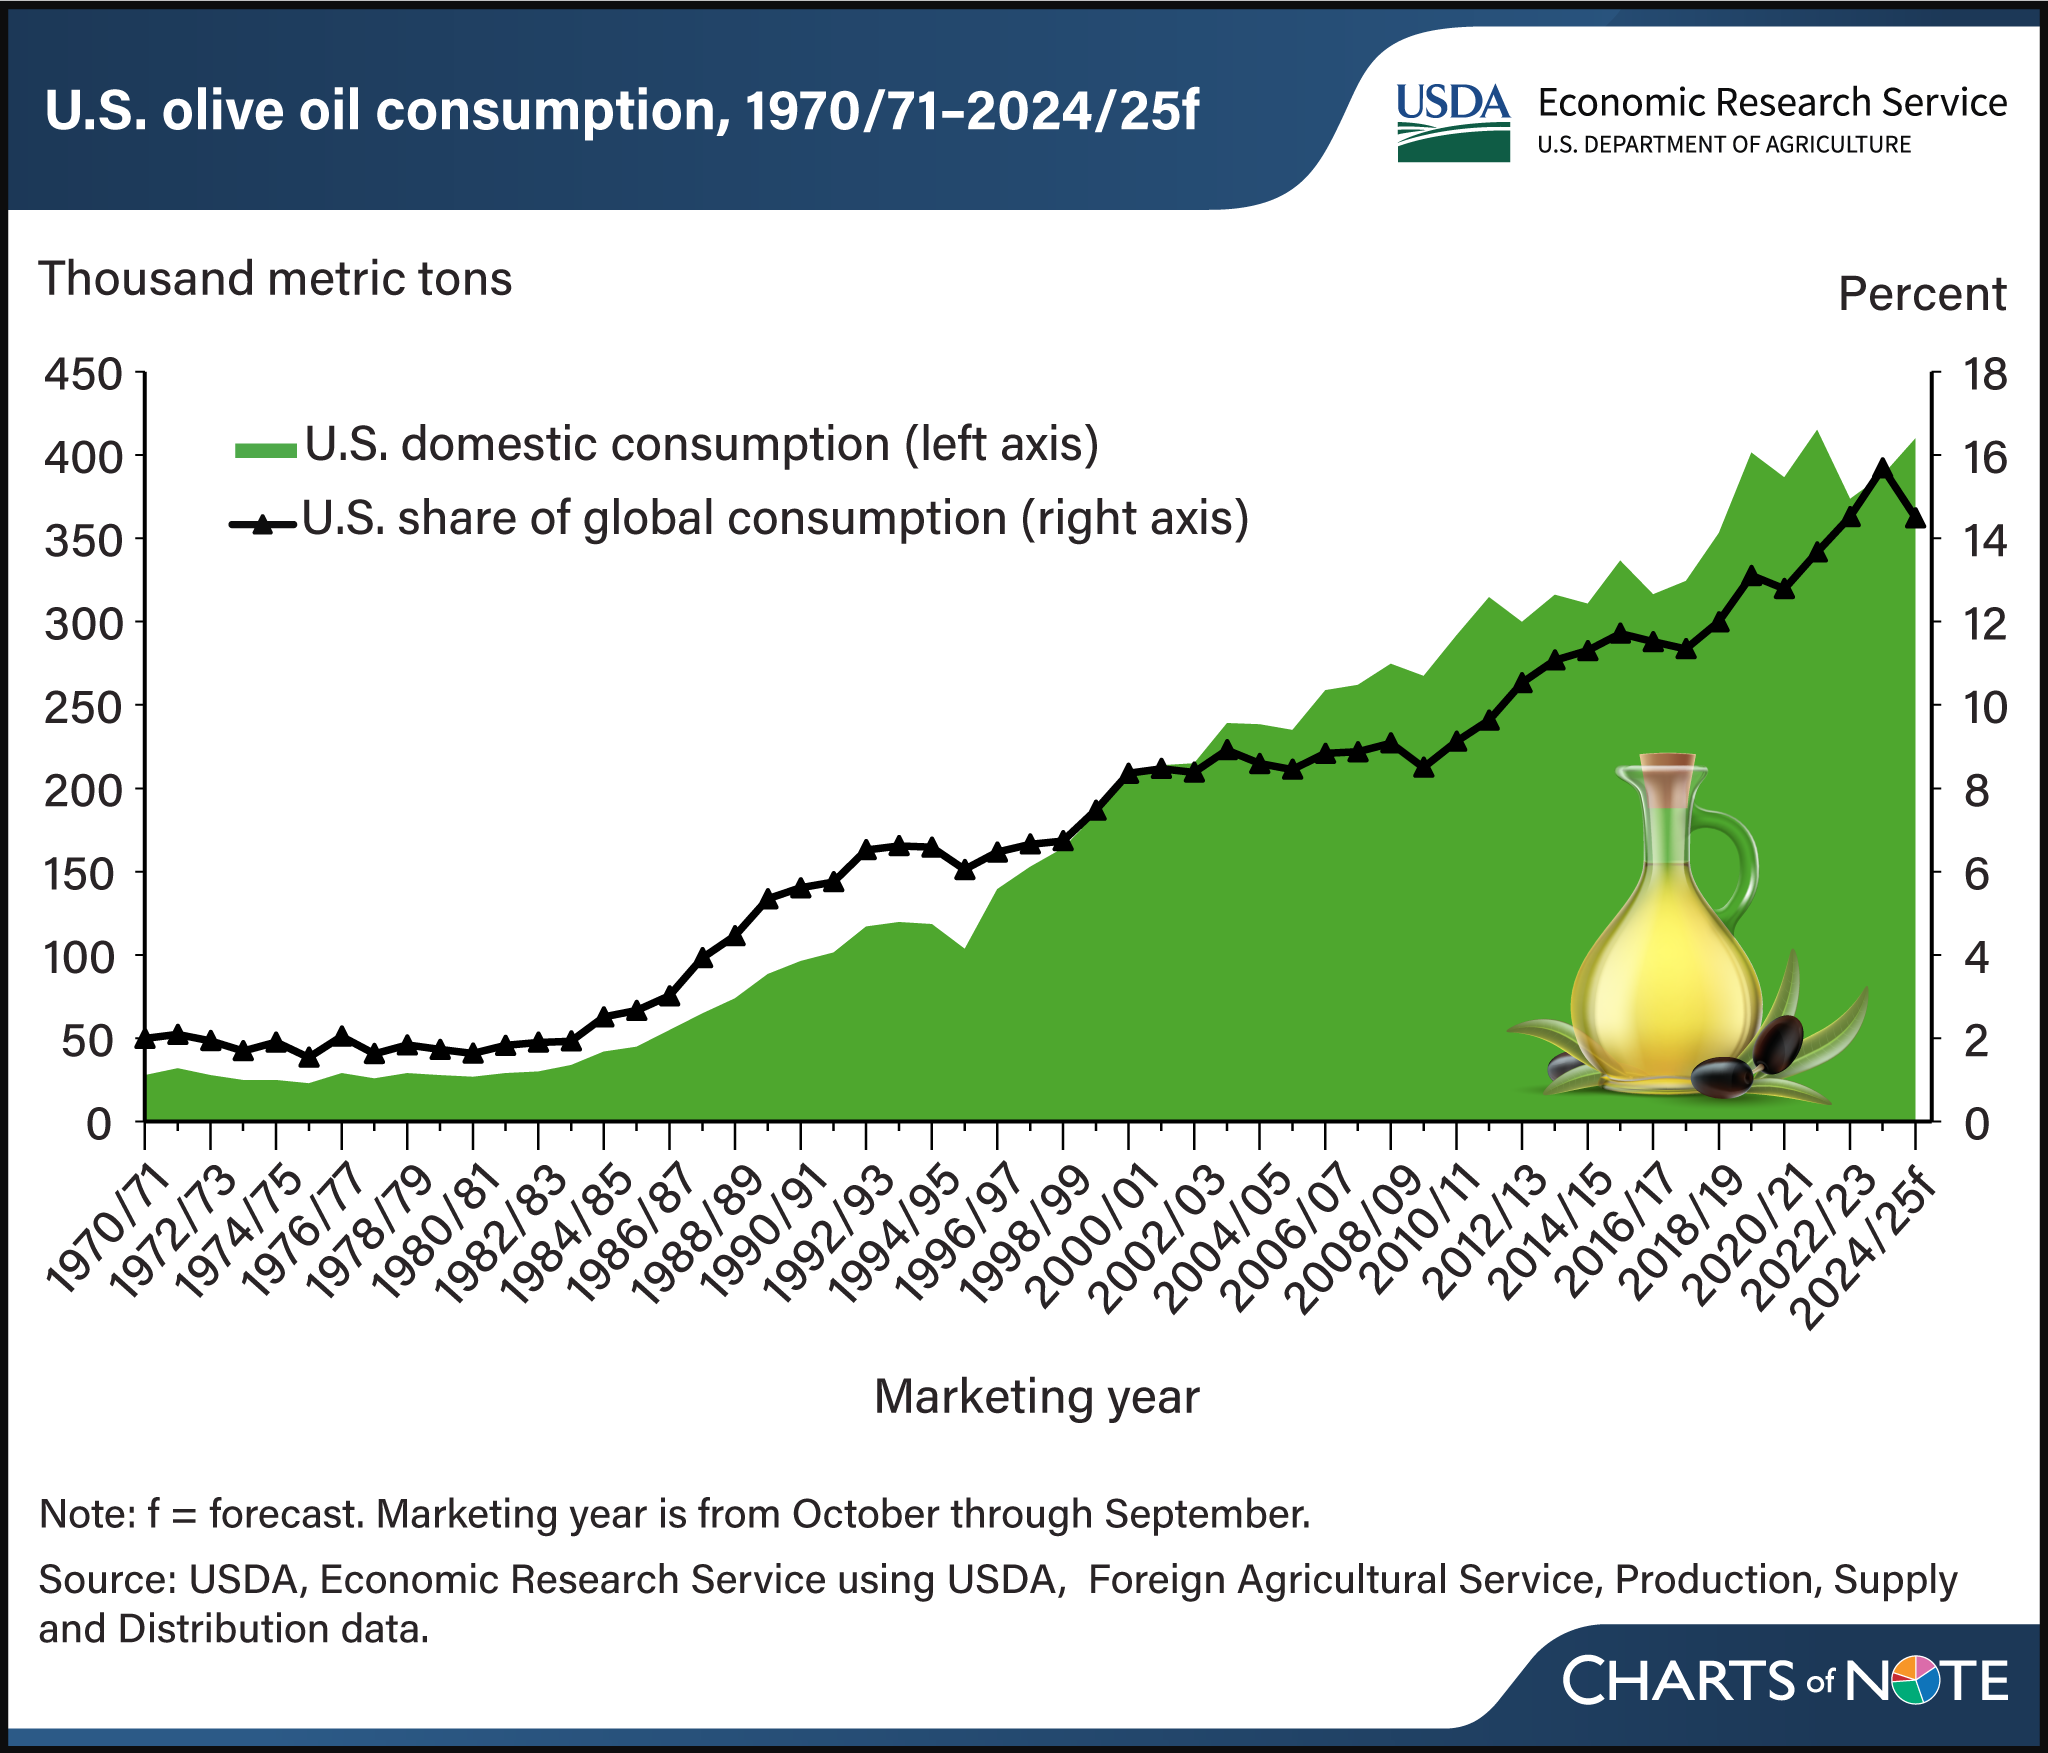
Rising popularity of olive oil in the United States has boosted consumption over past 30 years
- by Bryn Swearingen and Catharine Weber
- 12/12/2024

Olive oil’s popularity in the United States has increased since the 1990s, along with rising consumer awareness of its nutrition attributes and unique flavor and taste. U.S. consumption grew from 28,000 metric tons in the early 1970s to more than 400,000 metric tons in the 2020s. Global olive oil consumption also has grown over this 50-year period, and the United States accounts for more than 15 percent of global consumption. Because U.S. production represents less than 2 percent of U.S. olive oil consumption, imports help meet domestic demand. U.S. olive oil imports largely come from the European Union (EU), particularly the leading olive oil-producing countries of Spain, Italy, and Greece. Recent droughts affected the 2022/23 and 2023/24 EU olive crops, and global olive oil production fell almost 30 percent over those 2 marketing years. Lower global production and the depletion of stocks drove prices to record highs. With limited EU supplies, the United States sourced olive oil from Turkey and Argentina, among other countries. In 2024/25, global olive oil production is forecast to rebound, which is expected to decrease prices and boost consumption. This chart is drawn from USDA, Economic Research Service’s Oil Crops Outlook, published in November 2024.

