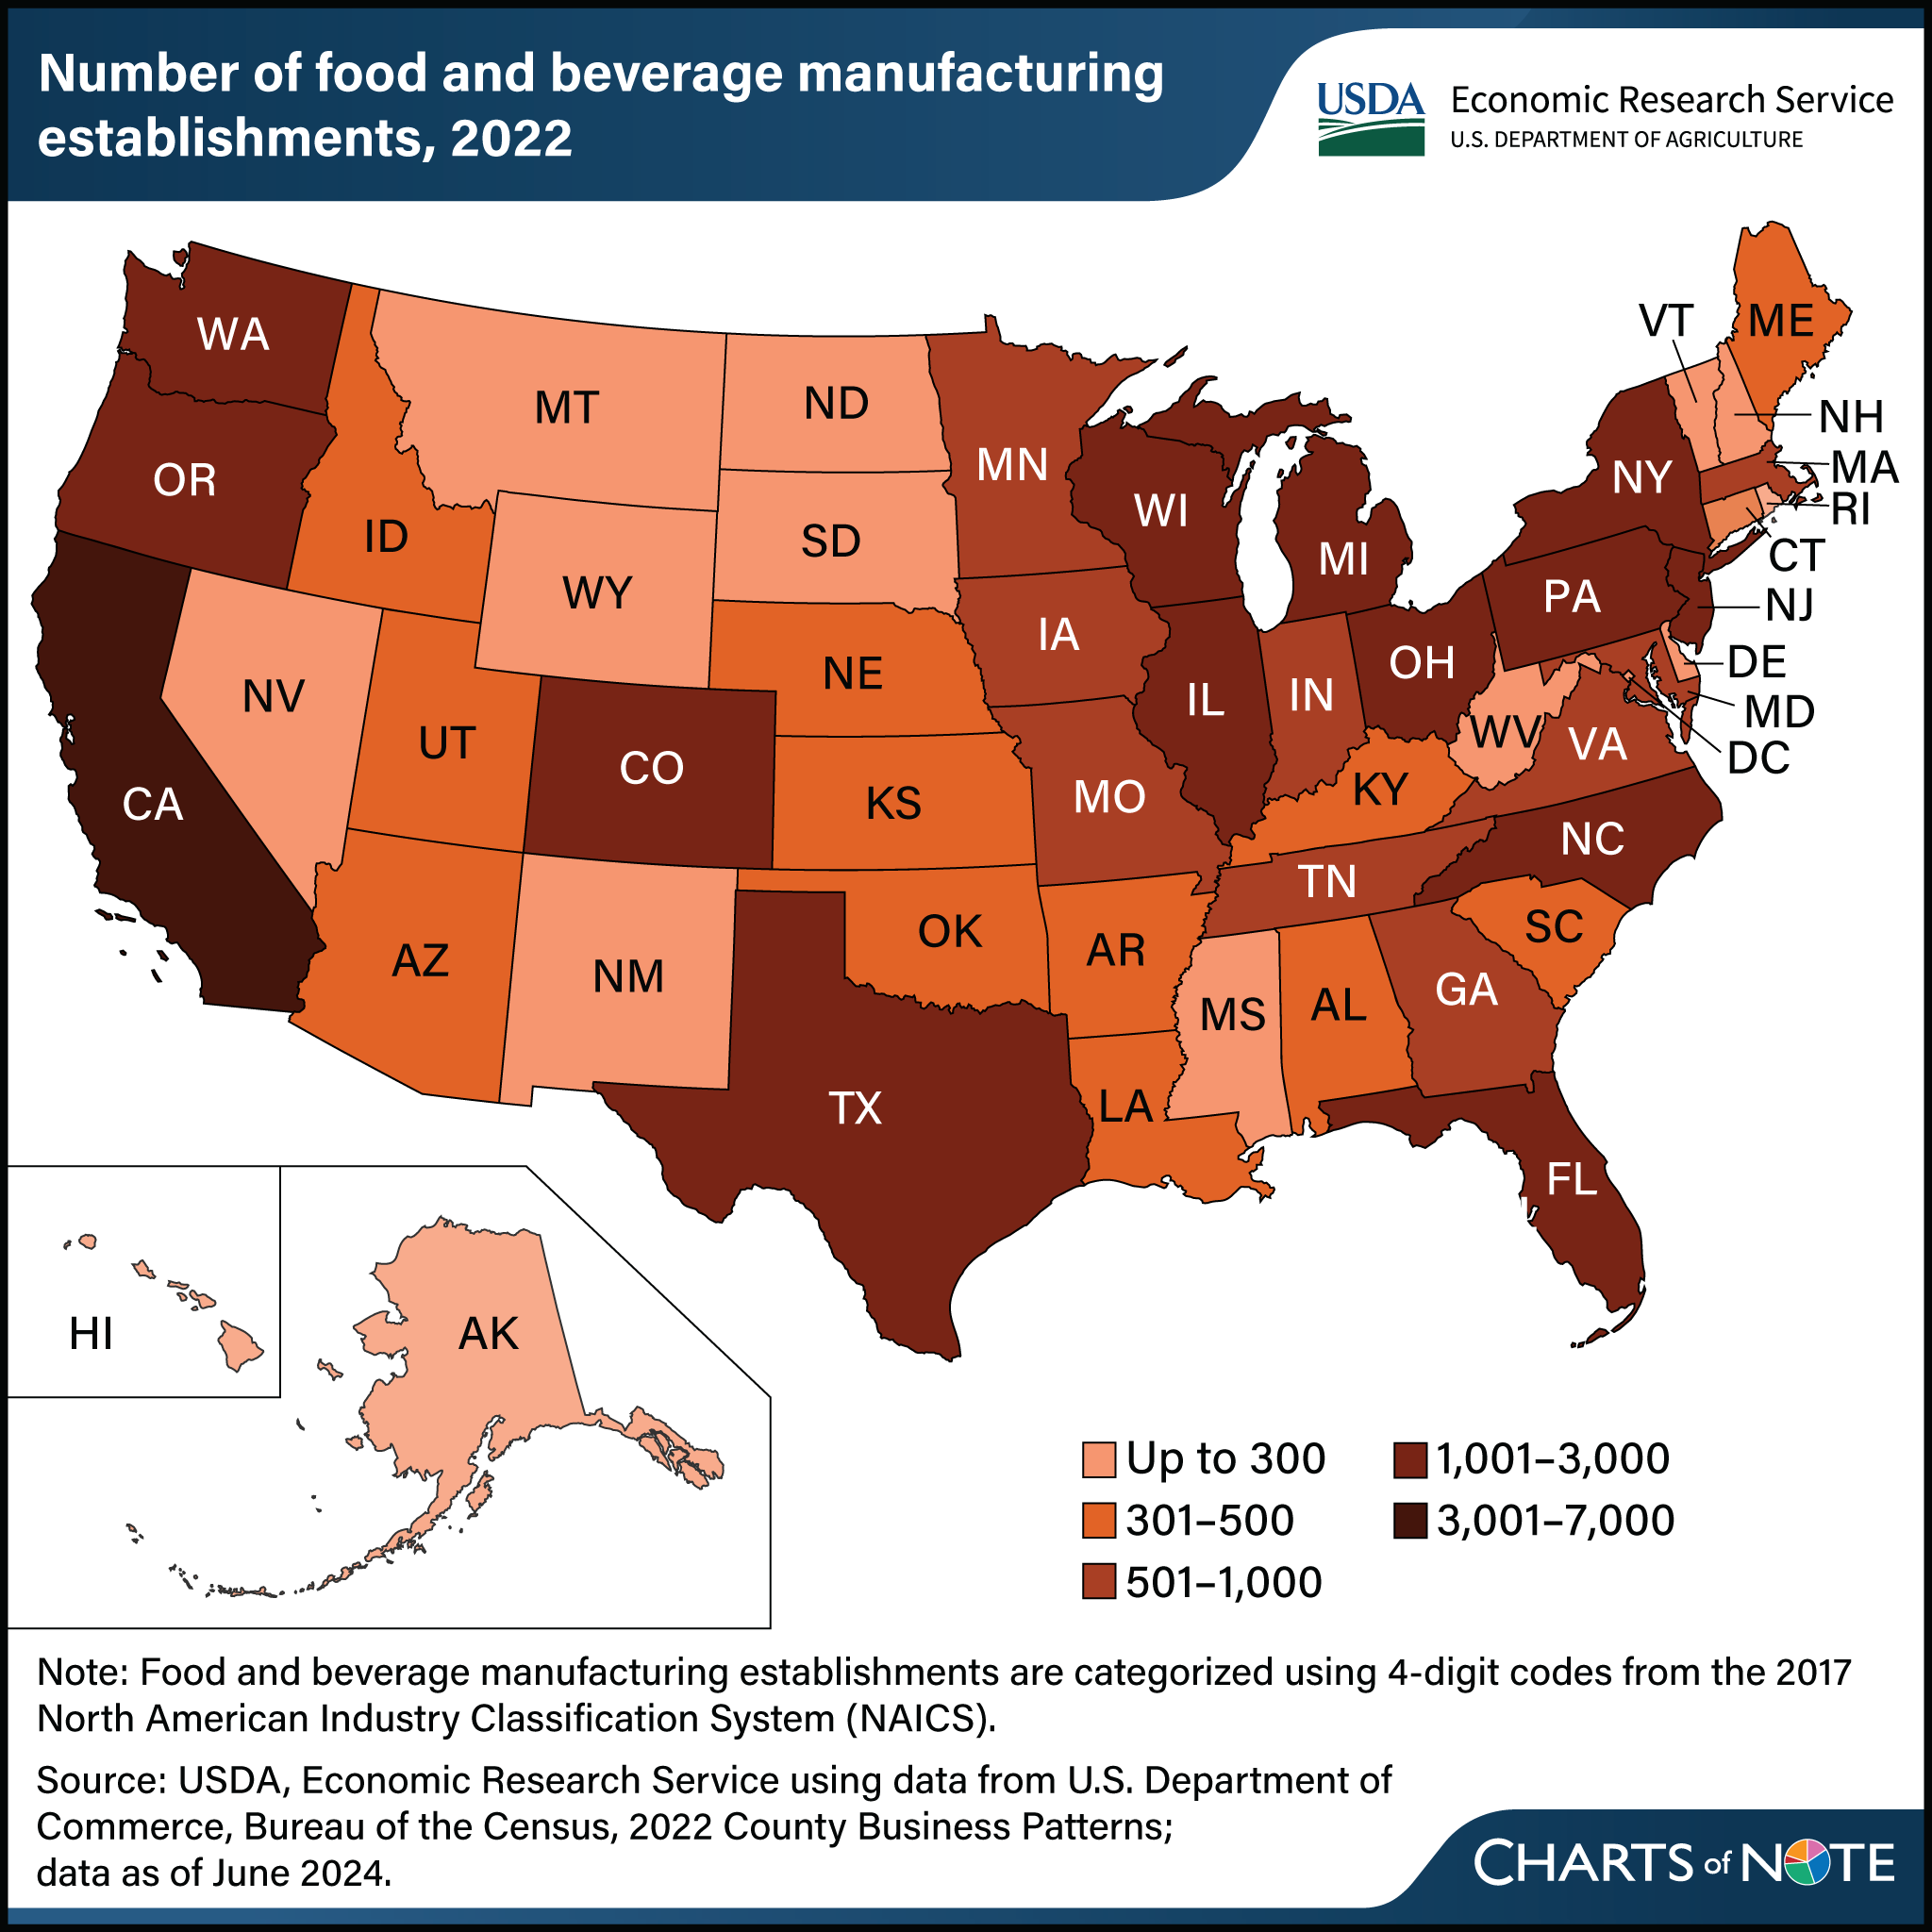
California led Nation in food and beverage manufacturing establishments in 2022
- by James Chandler Zachary
- 10/17/2024

In 2022, there were 42,708 food and beverage manufacturing establishments in the United States, according to the U.S. Department of Commerce, Bureau of the Census's County Business Patterns. Food and beverage manufacturing establishments turn raw food commodities into products for intermediate or final consumption. Food and beverage processing establishments are located throughout the United States, but California had the most such establishments at 6,569, or 15 percent of the total. Texas (2,898) and New York (2,748) were the second- and third-leading food and beverage manufacturing States. California led the Nation for every category of food and beverage manufacturing establishments except “animal slaughtering and processing,” for which Texas had 288 establishments, and “seafood processing and packaging,” for which Alaska had 86 establishments. The number of manufacturing establishments for other industry segments are also reported in County Business Patterns. This chart appears on the USDA, Economic Research Service’s Food and Beverage Manufacturing topic page.
We’d welcome your feedback!
Would you be willing to answer a few quick questions about your experience?

