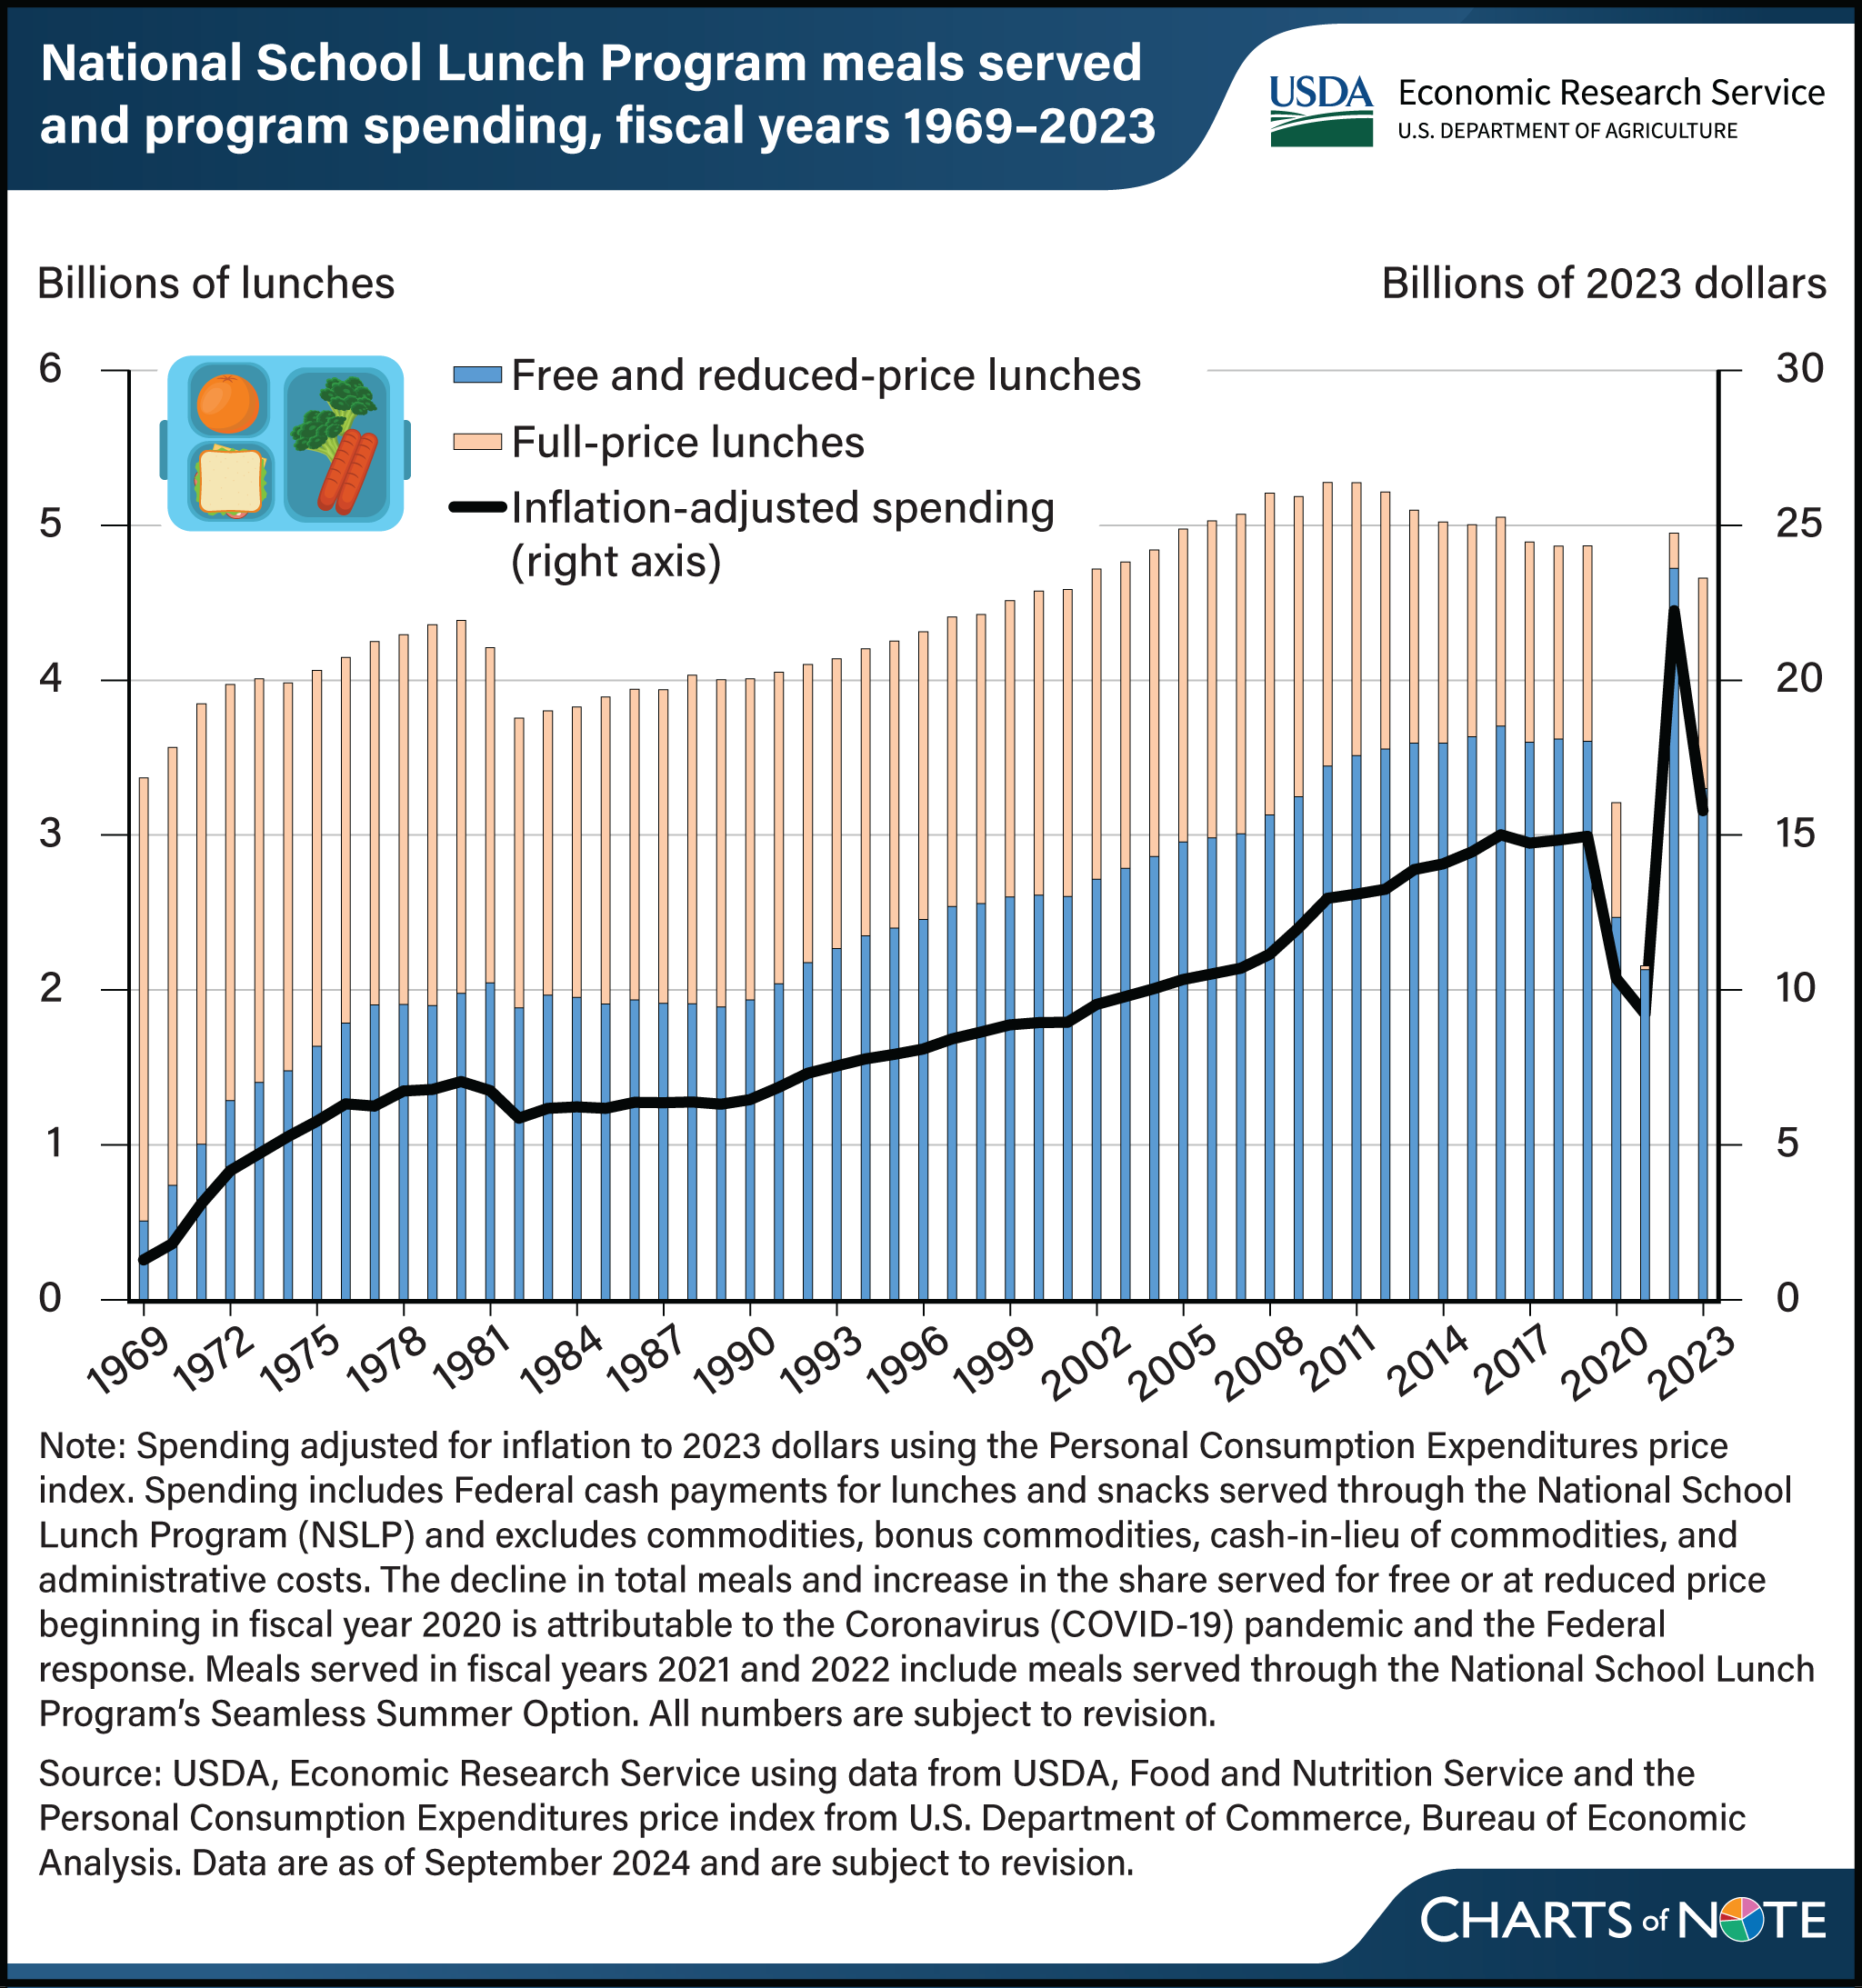
USDA’s National School Lunch Program served about 241 billion lunches from fiscal years 1969 through 2023
- by Saied Toossi, Jessica E. Todd, Joanne Guthrie and Michael Ollinger
- 10/9/2024

USDA’s National School Lunch Program (NSLP) served 4.7 billion lunches in fiscal year (FY) 2023, and nearly 241 billion lunches since FY 1969. Students are typically eligible for either a free, reduced-price, or full-price lunch through the program depending on their household’s income. In many schools, the NSLP allows all students to be served free meals regardless of their household income, a policy colloquially known as “universal free meals.” About 136 billion, or 56.4 percent, of all NSLP lunches served since FY 1969 were served for free or at a reduced price, and that share has been increasing over time. The share of lunches served for free or at a reduced price rose from 15.1 percent in FY 1969 to 74.1 percent in FY 2019. An even higher share of lunches was served for free or at a reduced price from FY 2020 through FY 2022 largely because of USDA waivers allowing meals to be provided free of charge to all students nationwide during the Coronavirus (COVID-19) pandemic. USDA pandemic waivers also allowed schools to serve meals through the Summer Food Service Program or the NSLP’s Seamless Summer Option in those years, while the temporary Pandemic Electronic Benefit Transfer (P-EBT) program reimbursed eligible families for the value of school meals missed because of pandemic-related disruptions to school operations. The waivers expired in Summer 2022, while P-EBT expired at the end of FY 2023. Spending on the program has also increased over time, from an inflation-adjusted $1.3 billion (in 2023 dollars) in FY 1969 to $15.8 billion in FY 2023. A version of this chart appears on the USDA, Economic Research Service (ERS) National School Lunch Program page within the Child Nutrition Programs topic page, as well as in the ERS report The National School Lunch Program: Background, Trends, and Issues, 2024 Edition, published September 2024.
We’d welcome your feedback!
Would you be willing to answer a few quick questions about your experience?

