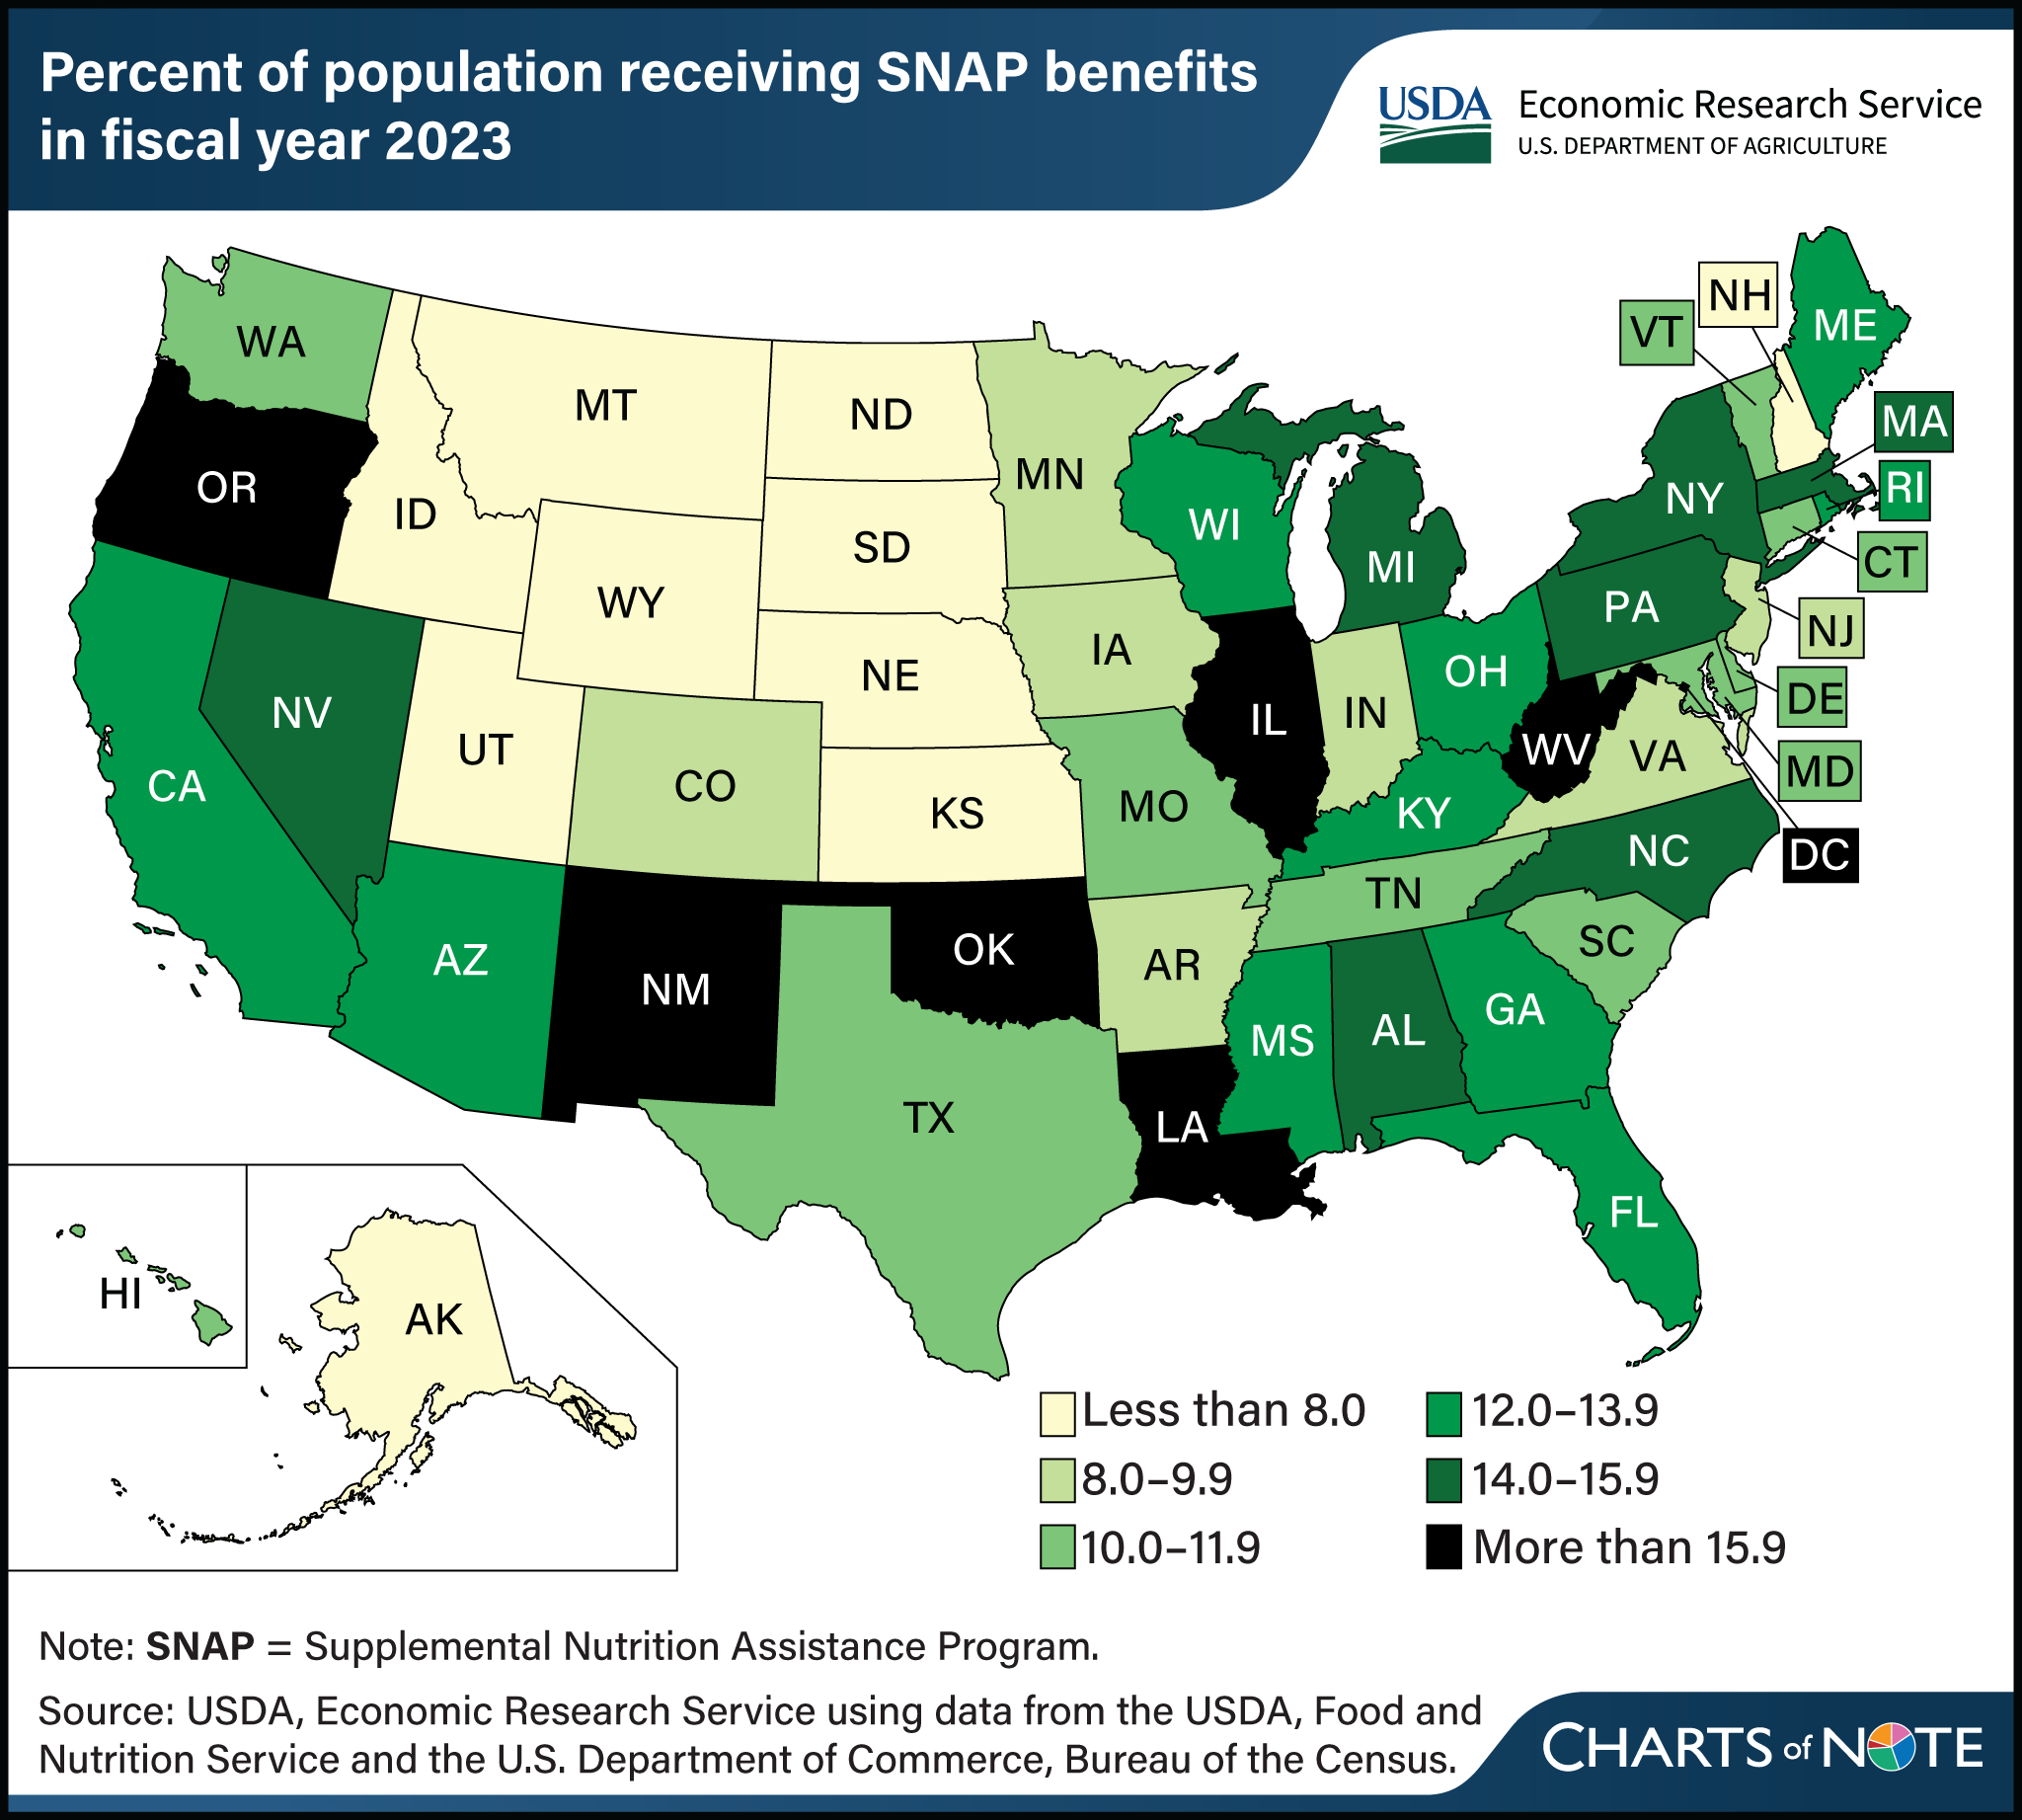
SNAP participation varied across States in fiscal year 2023
- by Laura Tiehen
- 8/28/2024

In fiscal year (FY) 2023, USDA’s Supplemental Nutrition Assistance Program (SNAP) served a monthly average of 42.1 million people in the 50 States and Washington, DC, representing 12.6 percent of the population. SNAP is the United States’ largest domestic nutrition assistance program, accounting for about two-thirds of USDA food and nutrition assistance spending in recent years. SNAP is available to most households with limited incomes and assets, subject to certain work and immigration status requirements. Participating households receive monthly benefits through an electronic benefit transfer card, which can be used like a debit card to buy food items at authorized retailers. SNAP participation varies across States, influenced by differences in the demographic characteristics of the population, program administration, and economic conditions. In FY 2023, the share of residents receiving SNAP benefits in each State ranged from as high as 23.1 percent in New Mexico to as low as 4.6 percent in Utah. In 34 States, the share was between 8 and 16 percent. This map appears in USDA, Economic Research Service’s Charting the Essentials, last updated in July 2024.
We’d welcome your feedback!
Would you be willing to answer a few quick questions about your experience?

