
Food source plays role in meeting Federal dietary recommendations
- by Diya Nair and Joanne Guthrie
- 8/6/2024
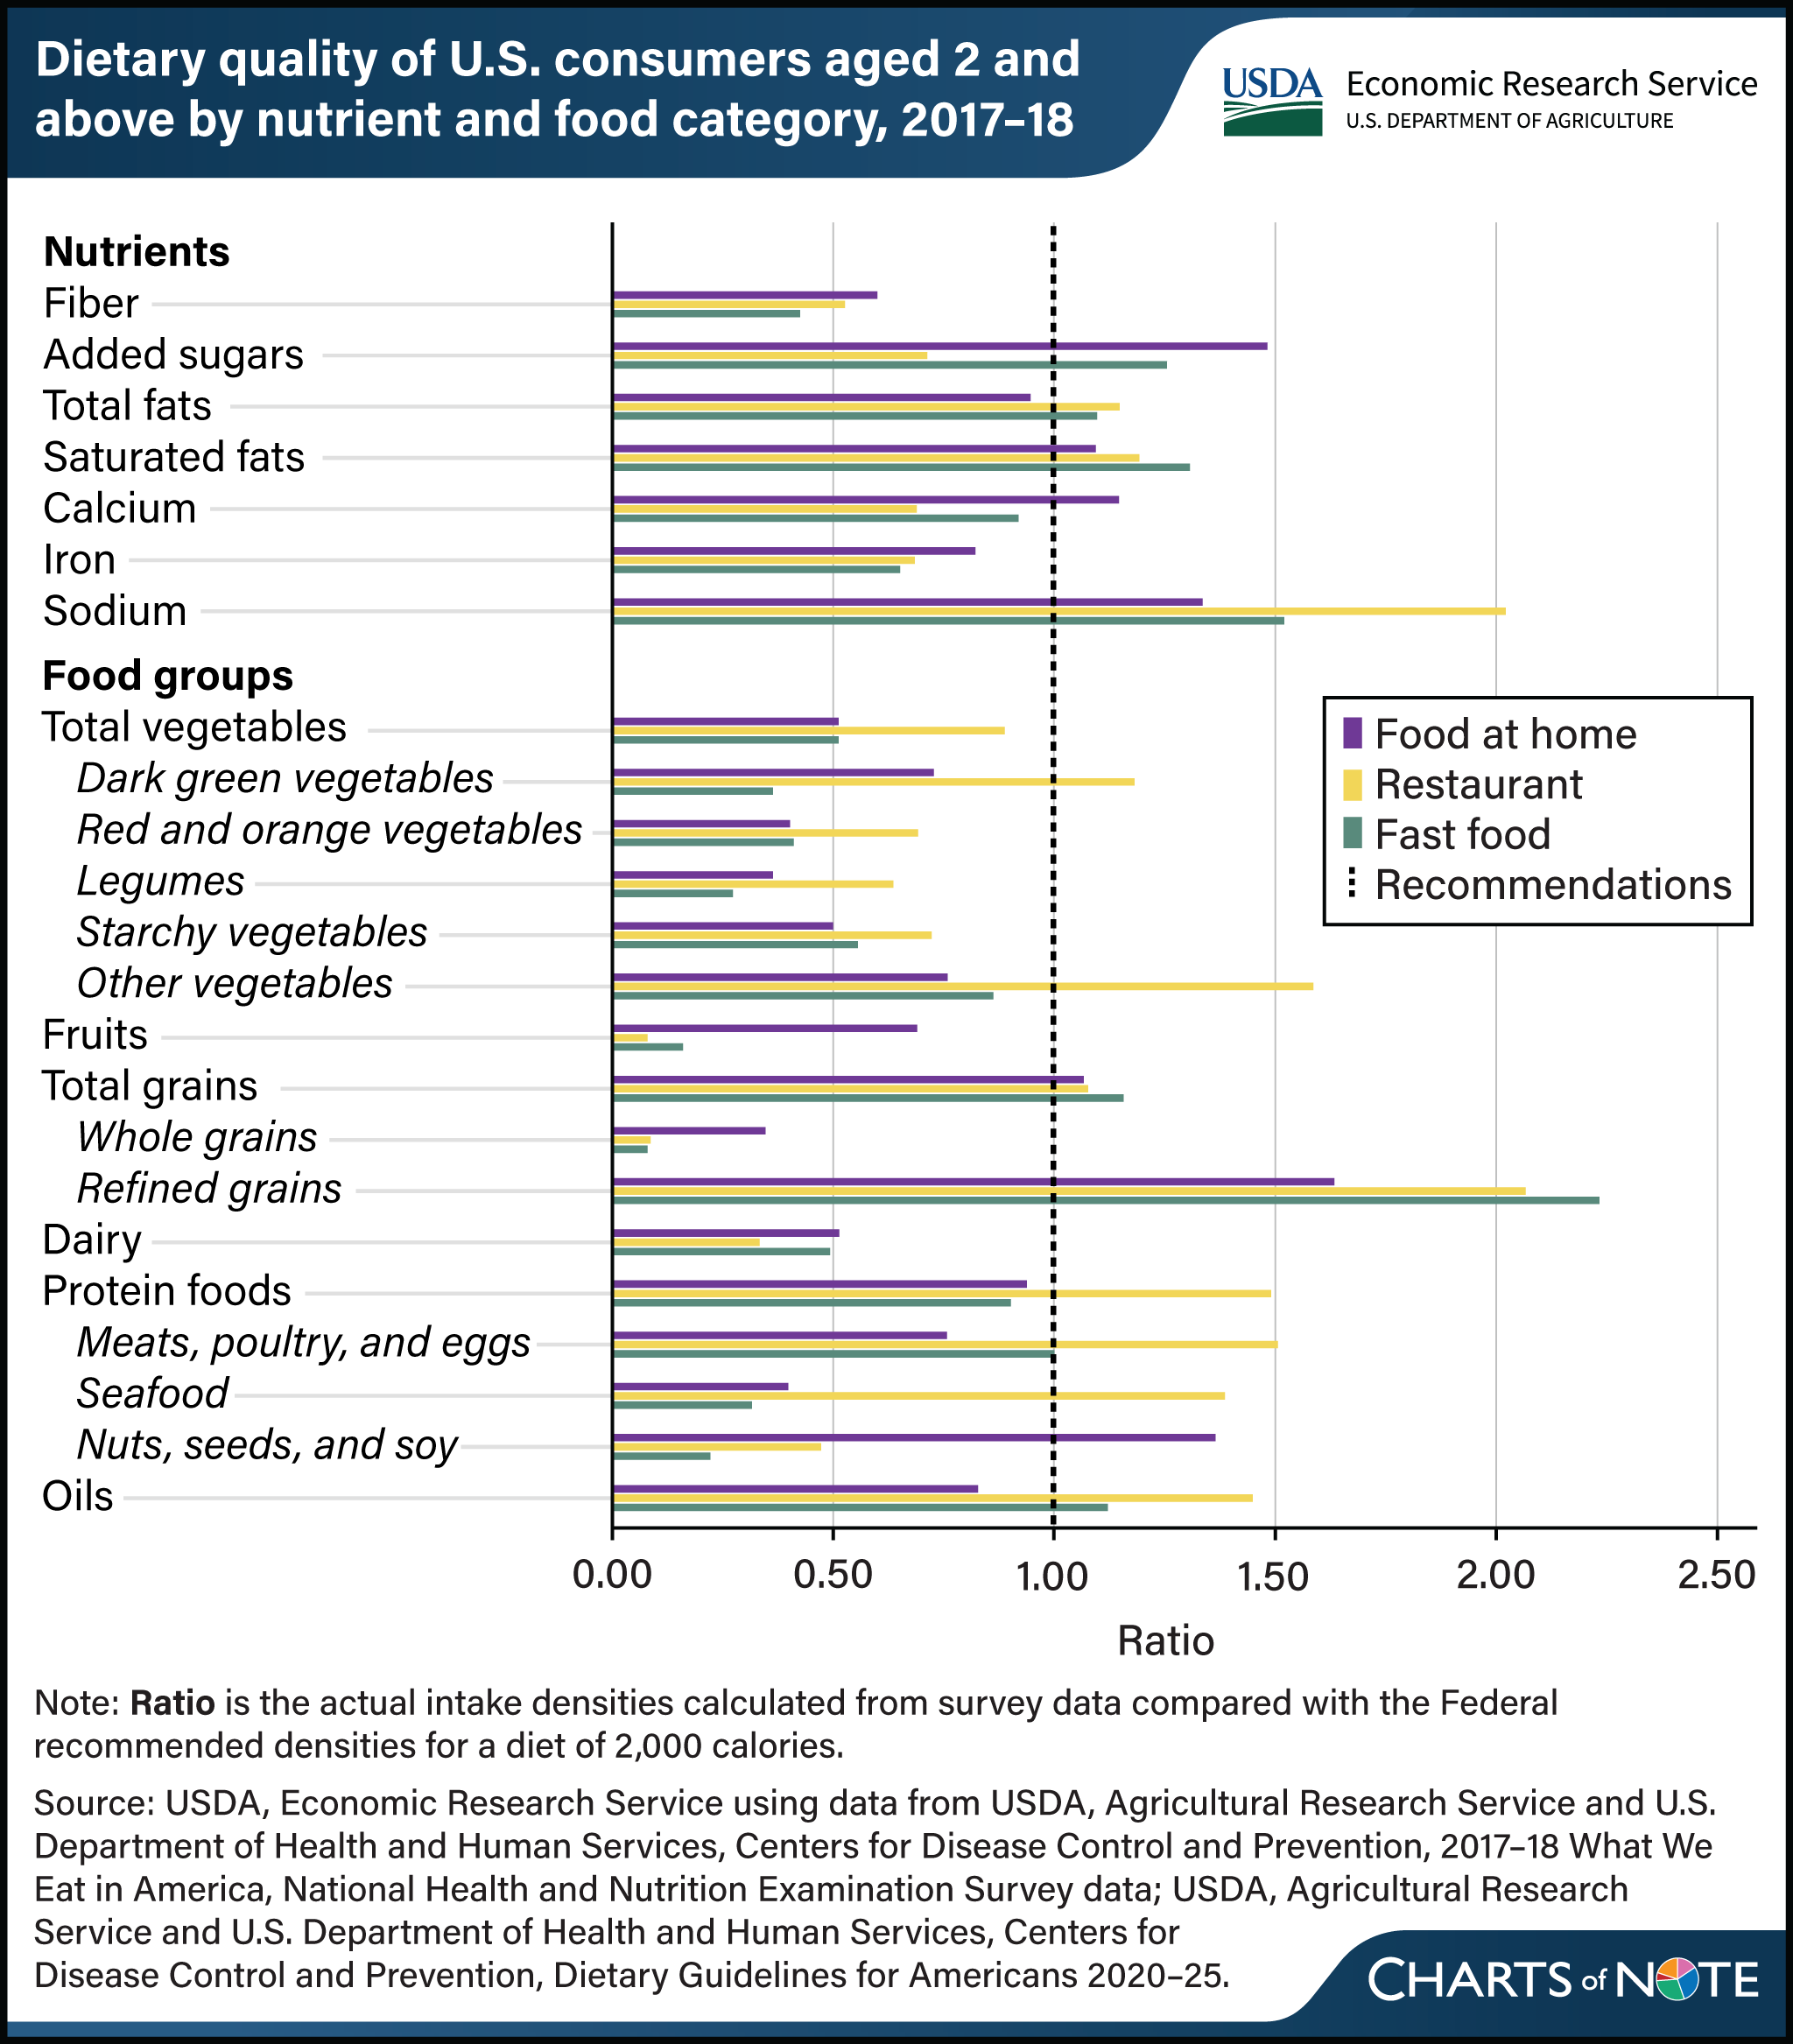
The nutritional quality of foods obtained from restaurants and fast food versus food prepared at home differs, with implications for meeting dietary recommendations. Researchers from USDA, Economic Research Service (ERS) and the University of Georgia used the latest available national food consumption survey data, collected in 2017–18, to examine differences in diet patterns by food source based on density, which is the amount of food consumed per 1,000 calories. They compared average consumption densities with what would be needed to match the Dietary Guidelines for Americans recommendations, assuming a 2,000-calorie daily intake. Foods from restaurants and fast-food places were lower in several nutrients—including fiber, calcium, and iron—and higher in saturated fat and sodium than food prepared at home in terms of density. Foods from restaurant and fast food places were also less dense in fruits, dairy, whole grains, nuts, seeds, and soy products and more dense in refined grains. On the other hand, restaurant foods were lower in added sugars and richer in vegetables, meats, poultry, eggs, and seafood relative to food prepared at home. Qualitative differences between foods from restaurants and fast-food places and food at home remain important considerations for policies and strategies designed to improve diet and health. This chart appears in the ERS report Dietary Quality by Food Source and Demographics in the United States, 1977–2018, published March 2023.