
Despite inflation, food-away-from-home spending continued to accelerate in 2023
- by Wilson Sinclair, Eliana Zeballos and Daniela Rivera-Cintron
- 7/11/2024
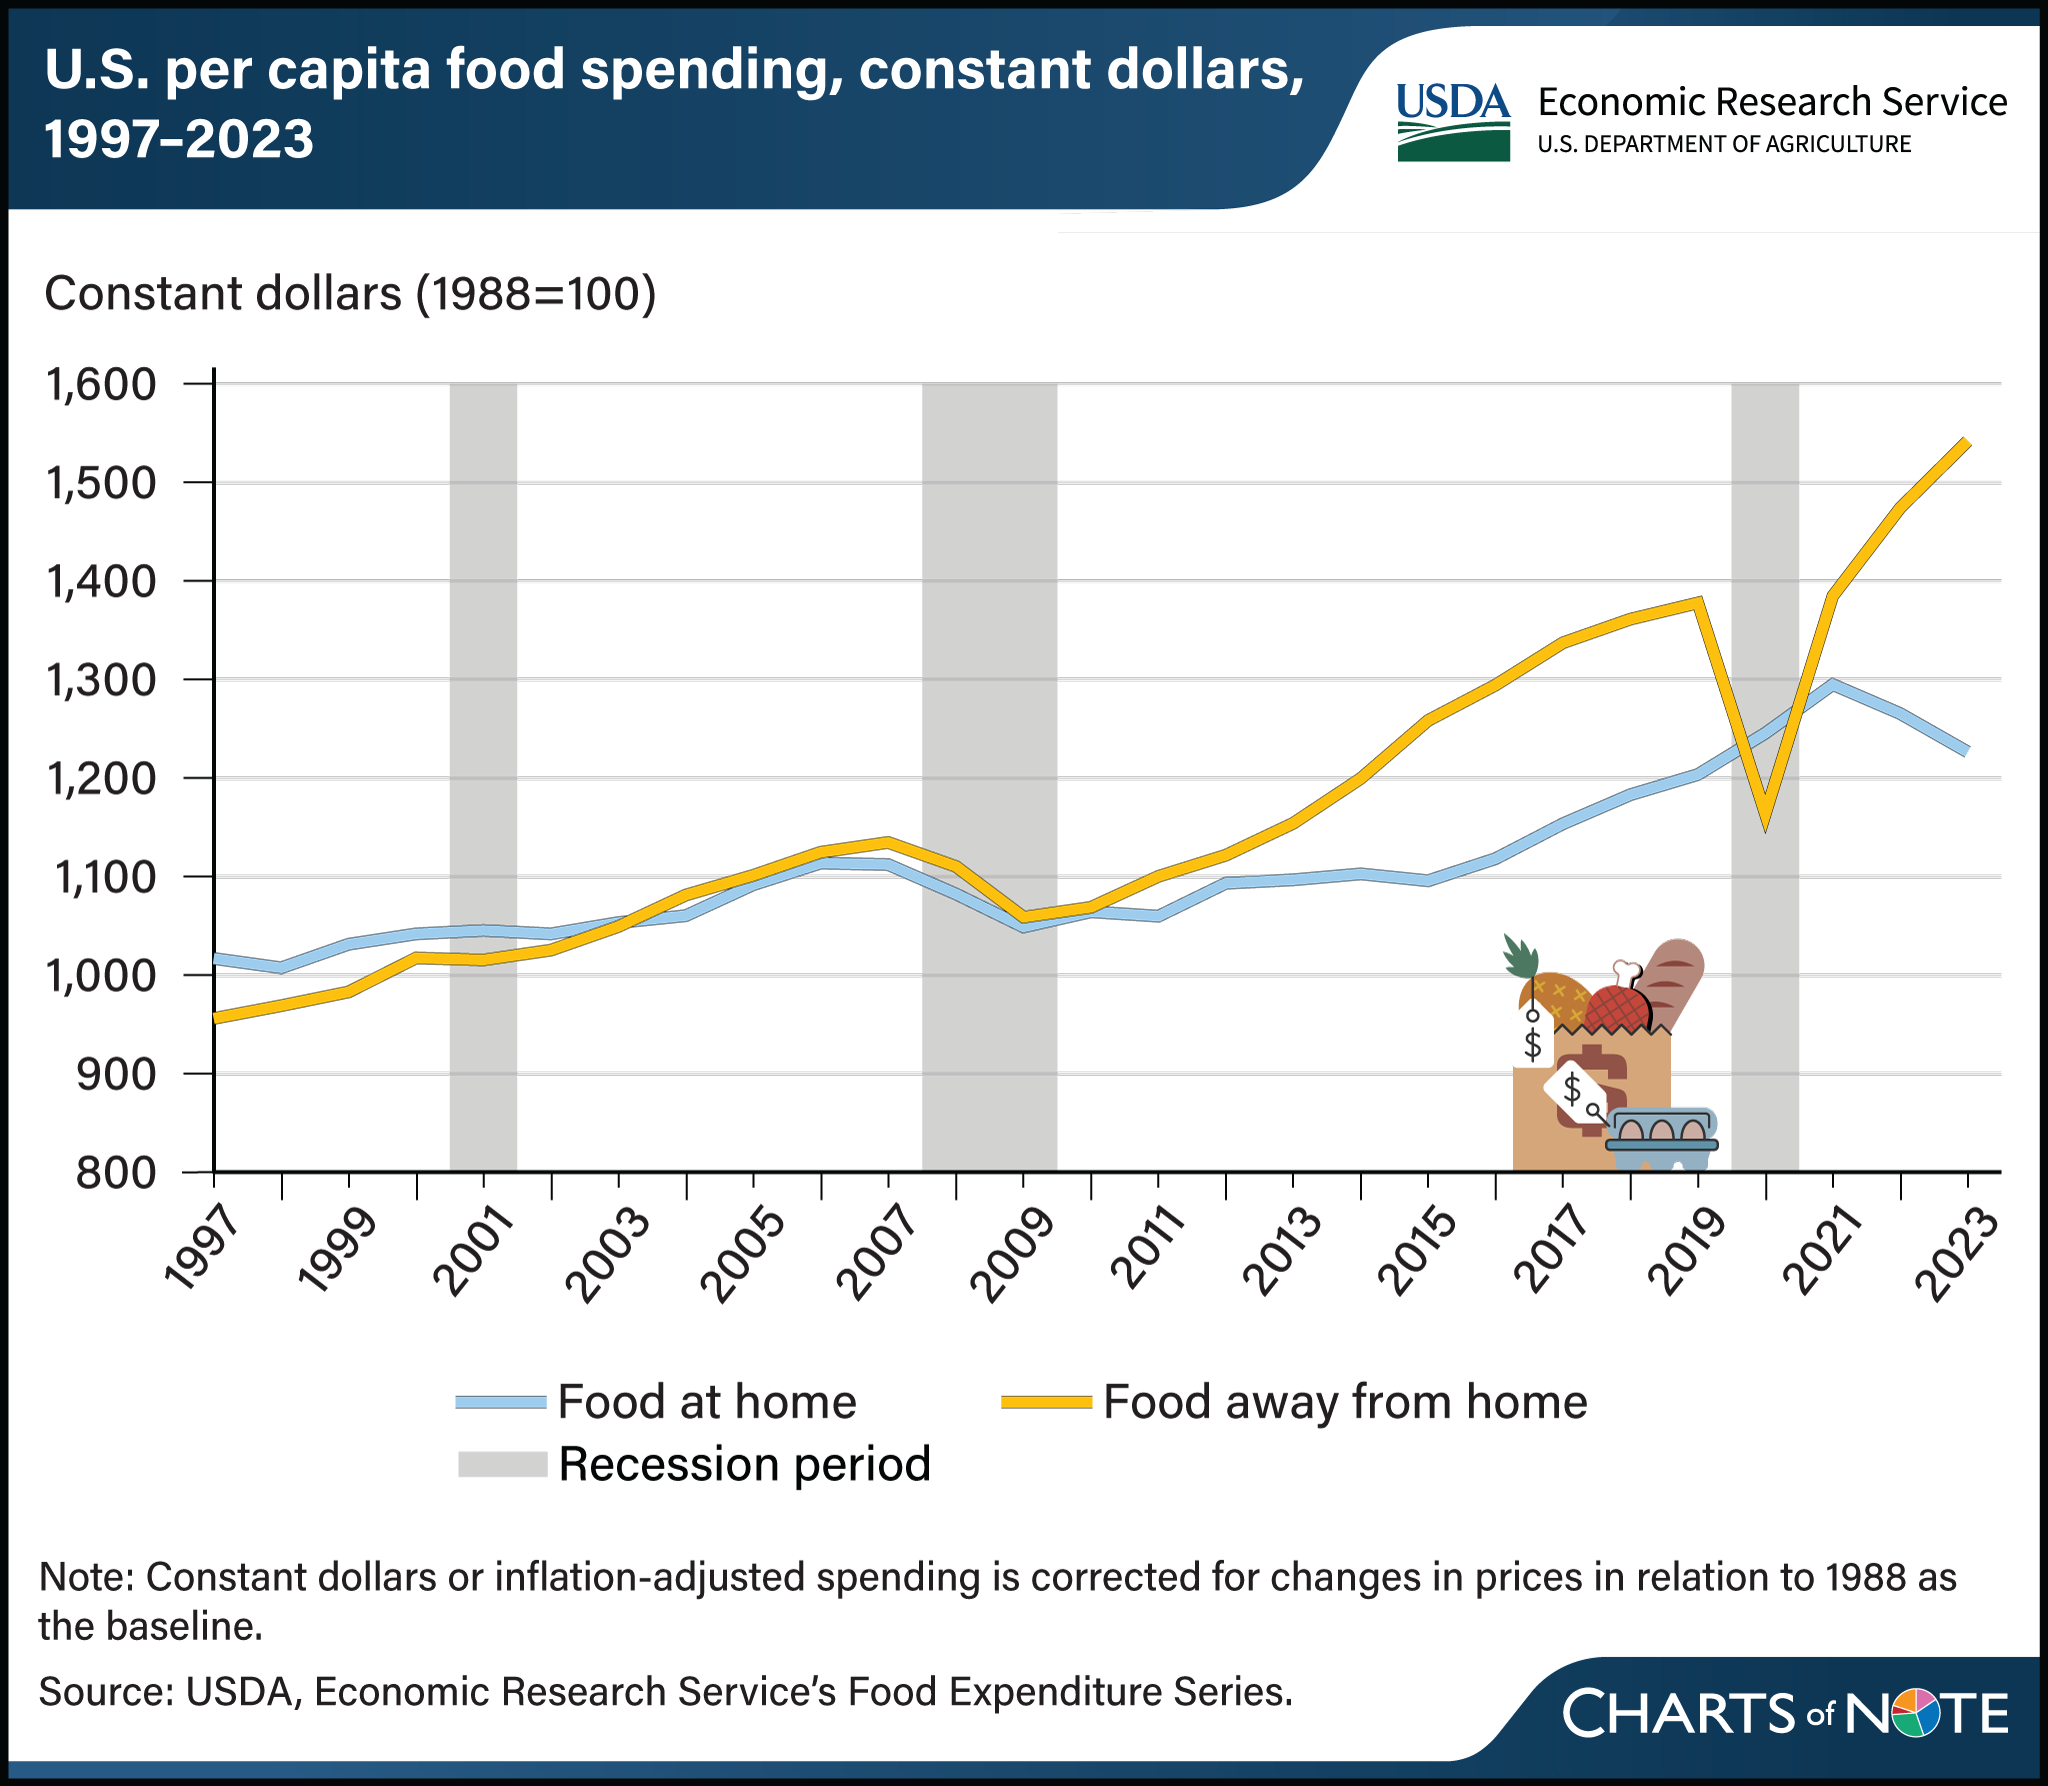
Food spending in the United States reached an all-time high in 2023. However, accounting for food price inflation and population growth reveals a nuanced narrative over time. Even after adjusting for inflation (known as constant terms), per capita food-away-from-home (FAFH) spending rebounded after a 15.6-percent drop in 2020 with an average annual increase of 10 percent since 2021. This trend resulted in an 11.9-percent increase in FAFH spending in 2023 compared with 2019, outpacing prepandemic trends. In contrast, constant per capita food-at-home (FAH) spending declined 2.3 percent in 2022 and 3.1 percent in 2023, following stable annual increases averaging 2.8 percent from 2016 to 2021. This chart is drawn from USDA, Economic Research Service’s Food Expenditure Series data product, updated in June 2024, and Interactive Charts: Food Expenditures, updated in September 2023.