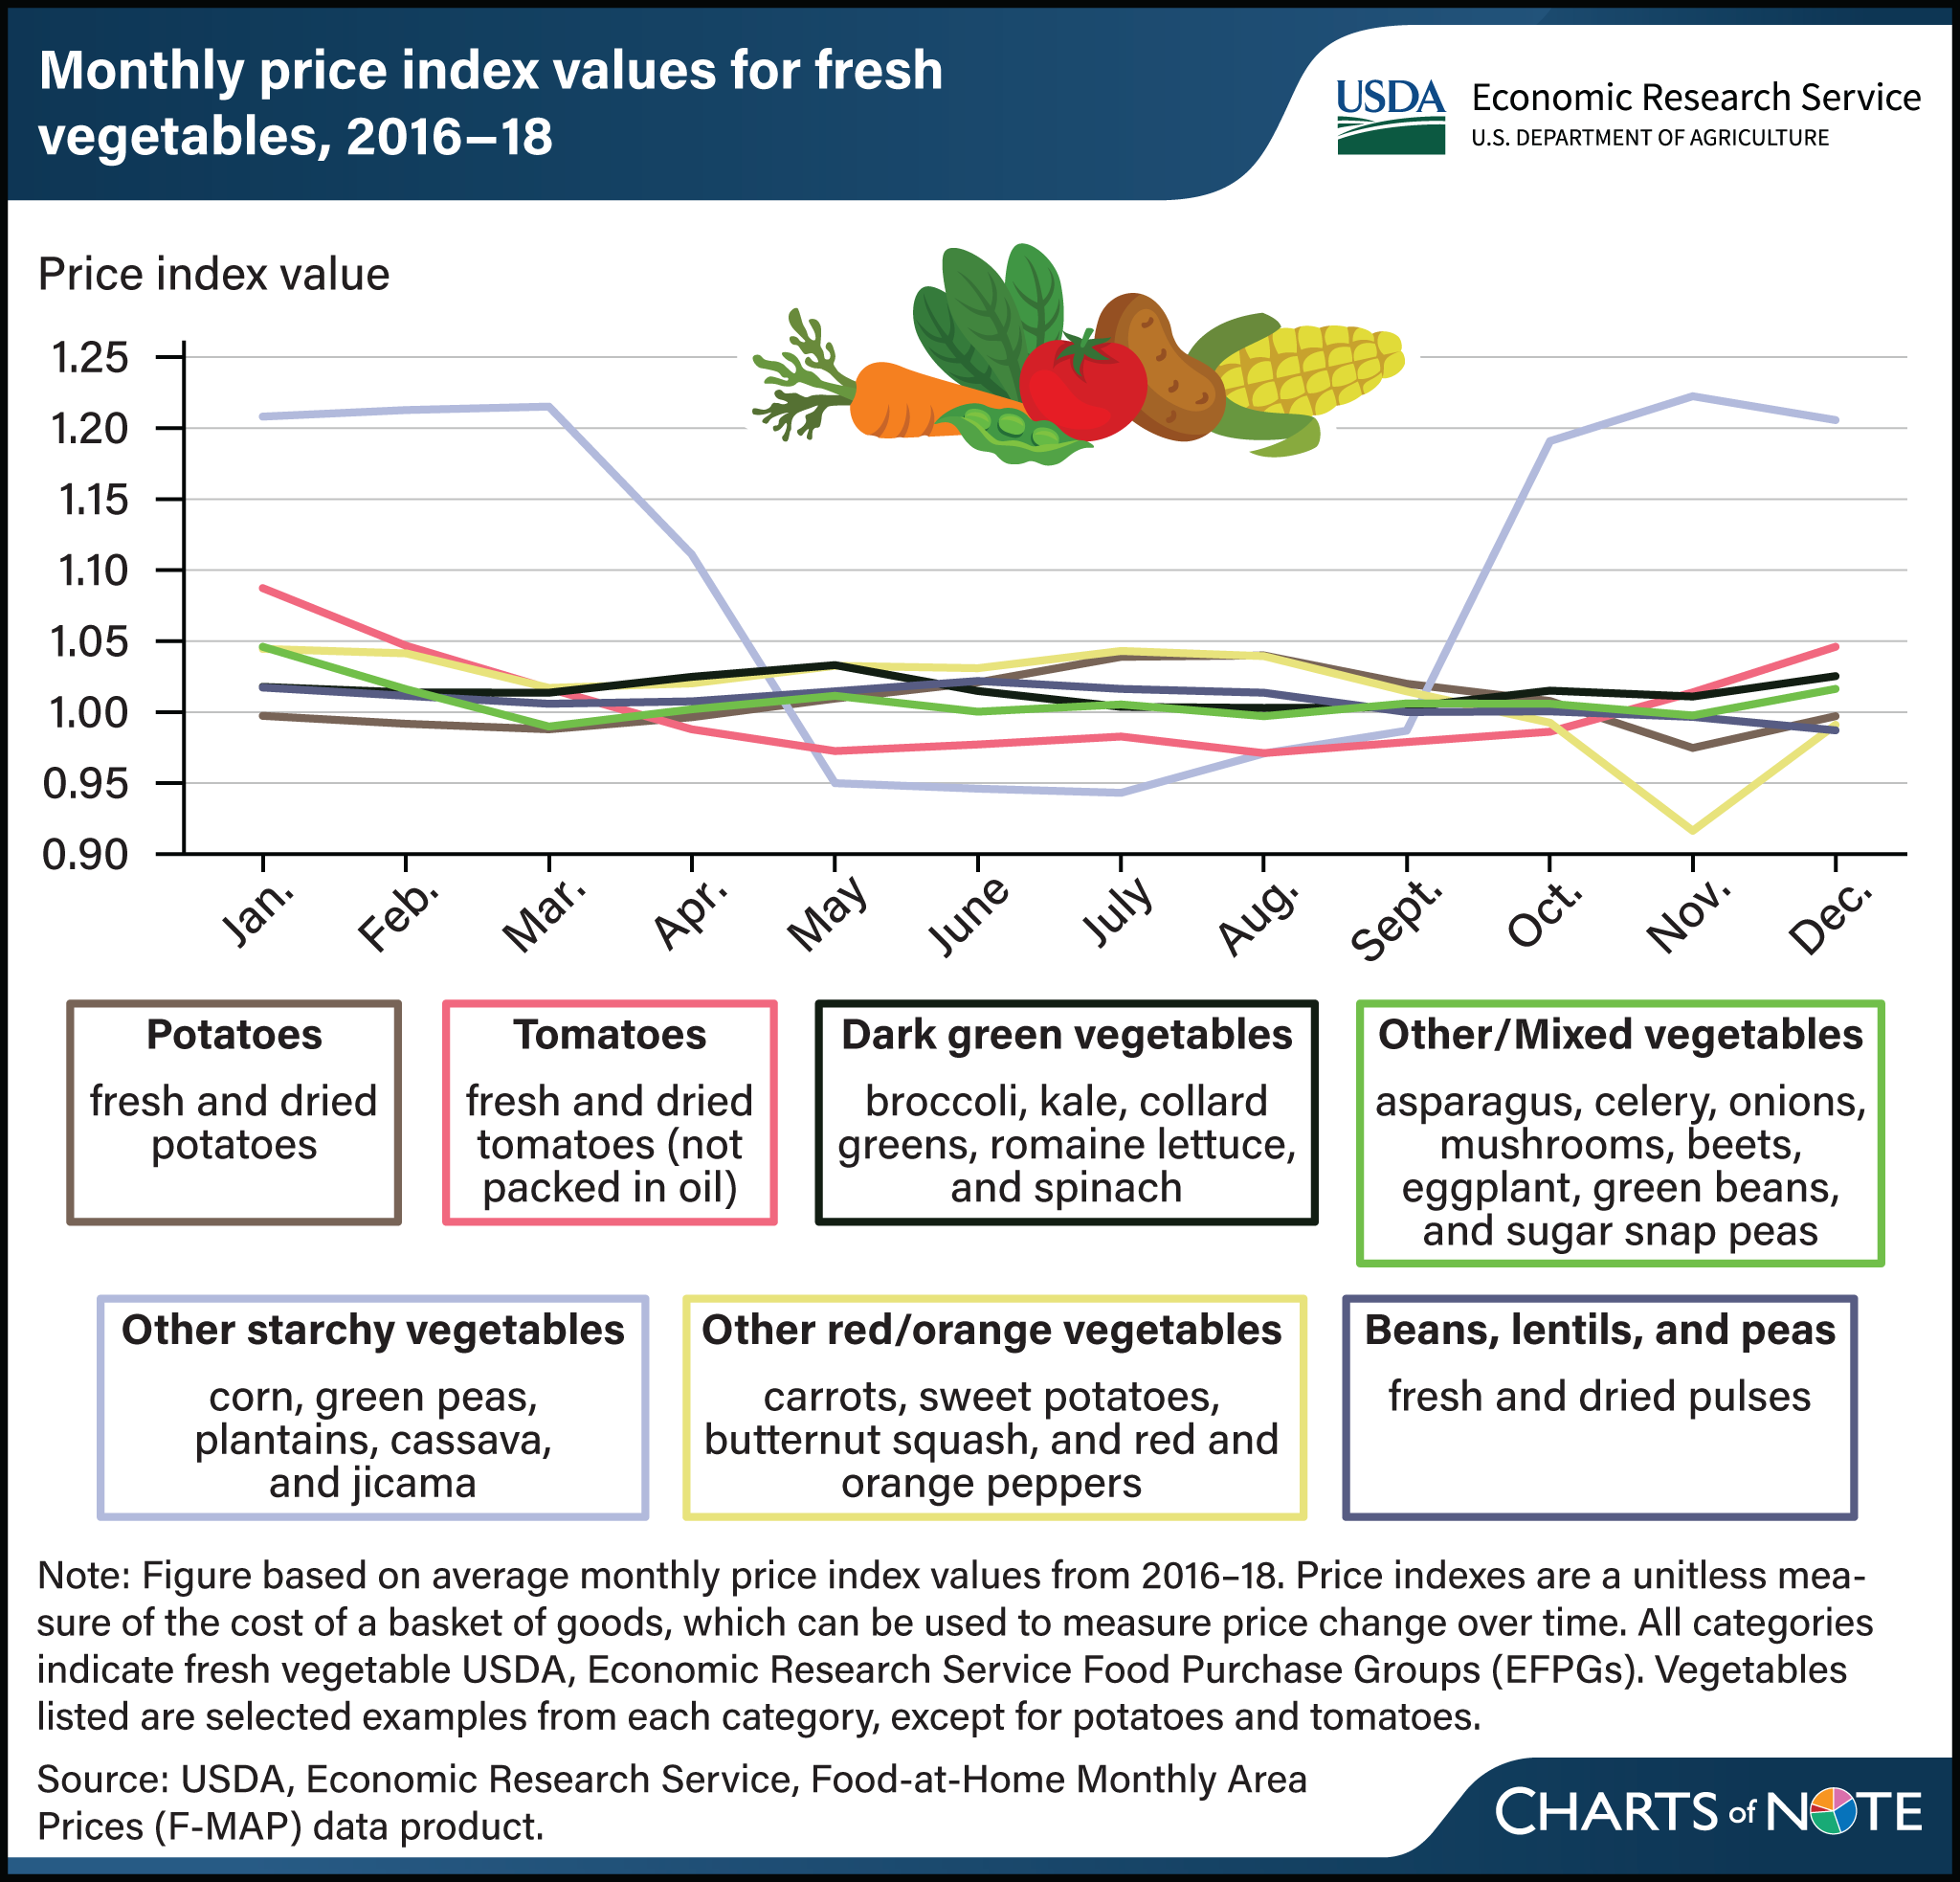
Starchy fresh vegetables (excluding potatoes) had the most seasonal price variation from 2016–18
- by Anne T. Byrne and Megan Sweitzer
- 5/14/2024

Food-at-home prices, especially for fresh produce, fluctuate throughout the year depending on seasonal shifts in supply and demand. The USDA, Economic Research Service (ERS) Food Purchase Groups (EFPGs) separate fresh vegetables into seven distinct categories: potatoes, tomatoes, other starchy vegetables, other red and orange vegetables, dark green vegetables, legumes (includes dried), and other/mixed vegetables. The ERS Food-at-Home Monthly Area Prices (F-MAP) data from 2016 through 2018 reveal that seasonal price variation is most pronounced in the other starchy vegetables category. The most common vegetable in that category is corn. The category with the least seasonal price variation is dark green vegetables. Fresh vegetables that are primarily sourced domestically or from North American trading partners may be more readily available in the summer months, causing prices to drop during that time. Spending on other starchy vegetables is highest in the summer months, which coincides with the lowest prices for these products, suggesting a demand response to lower prices and higher availability. Food-at-home price variation is measured in two ways using price indexes, or unitless measures of the cost of a basket of goods that can be used to track price change over time. First, standard deviations across monthly price indexes show how much prices deviate from the average. Second, ranges of monthly price indexes (i.e., the maximum price index minus the minimum price index) capture the difference between periods of seasonally low prices and periods of seasonally high prices. This chart is drawn from the ERS F-MAP data product, which is described in the ERS report Development of the Food-at-Home Monthly Area Prices Data, published in March 2024.

