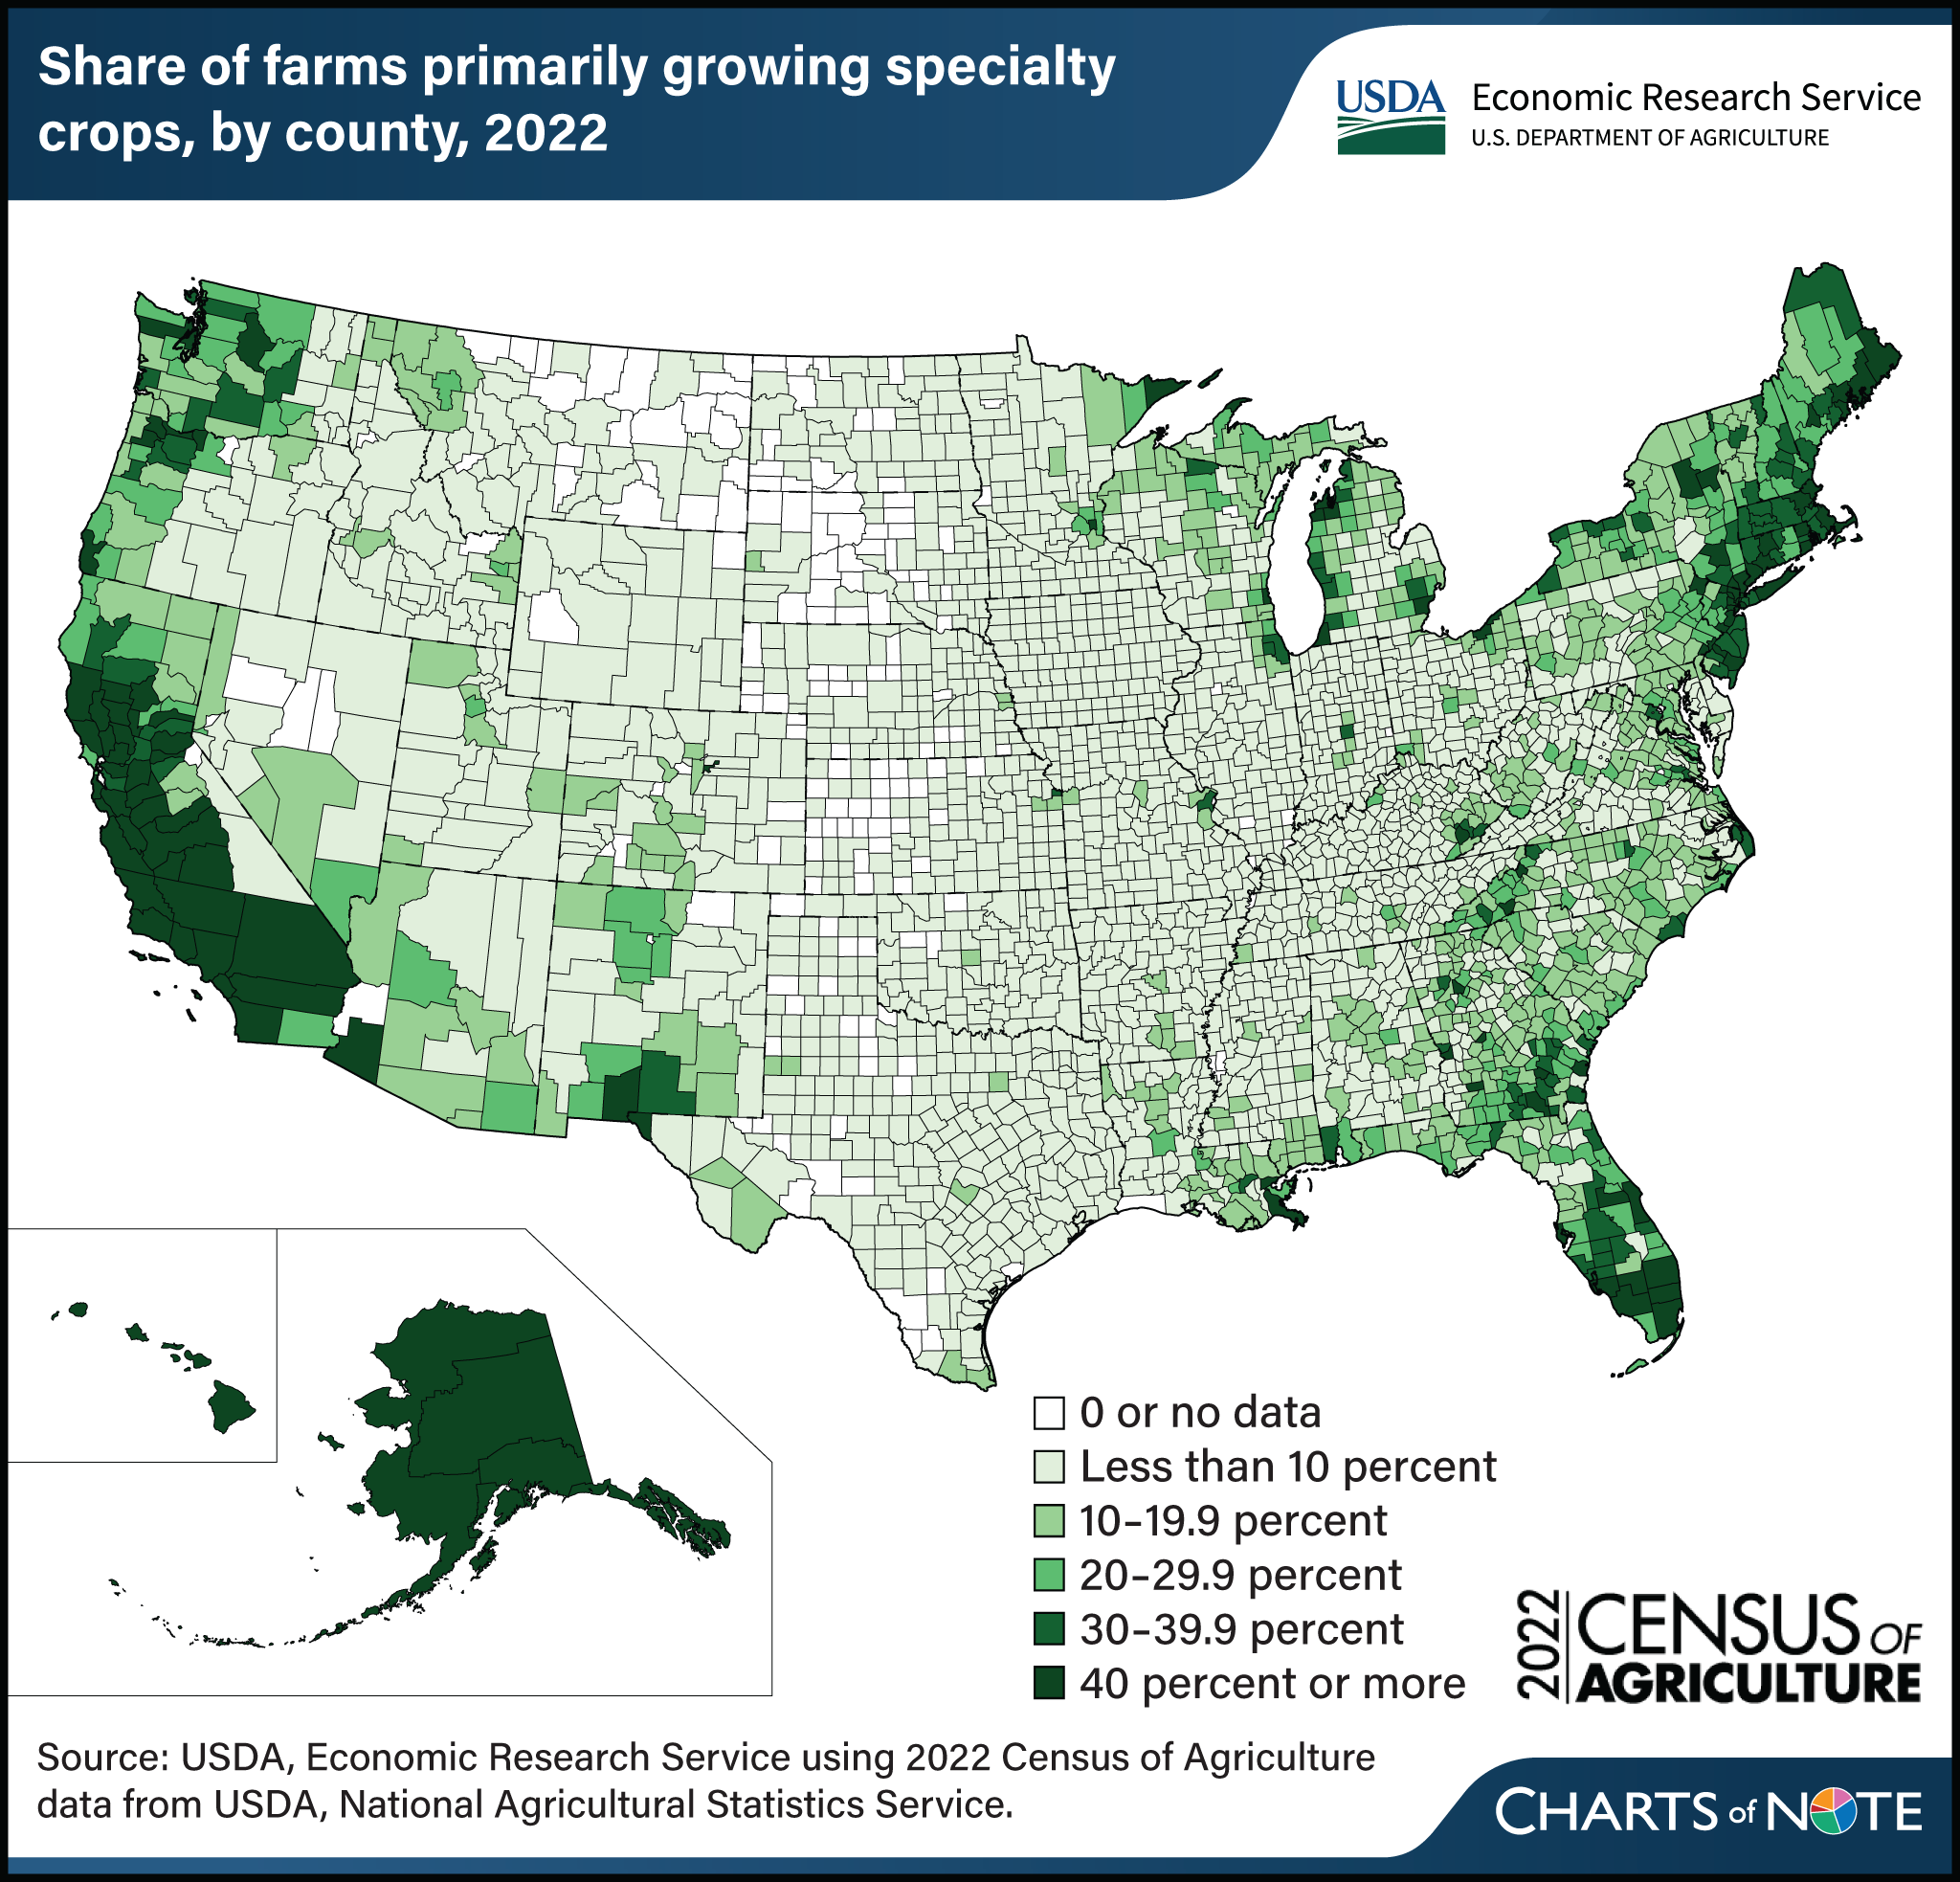
2022 Census of Agriculture: Most U.S. counties with high concentration of specialty crop farms are located along coasts
- by Carrie Litkowski and Jonathan Law
- 4/30/2024

Data from the recently released 2022 USDA Census of Agriculture show that farms specializing in specialty crops accounted for 10 percent of all farm operations. Specialty crop operations include those that primarily grow vegetables and melons, fruit and tree nuts, and greenhouse, nursery, and floriculture products, and are responsible for $84 billion in cash receipts (15 percent of the U.S. total). For 127 counties (or county equivalents), specialty crop farms accounted for more than 40 percent of all farms within the county. Most of these counties are in States along the west and east coasts (including Alaska and Hawaii) and in or near metropolitan areas. Half of the counties with the highest concentration of farms primarily engaged in growing specialty crops were in California, New York, Florida, and New Jersey. Almost all (95 percent) of U.S. counties with farms as well as every State had at least one farm growing primarily specialty crops. This chart was drawn from data from USDA, National Agricultural Statistics Service’s website. For more information on cash receipts by State and commodity, including specialty crop commodities, see USDA, Economic Research Service’s Farm Income and Wealth Statistics data product.
We’d welcome your feedback!
Would you be willing to answer a few quick questions about your experience?

