Mobile apps remained popular for quick-service carryout and delivery spending after pandemic-related increase
- by Keenan Marchesi
- 2/6/2024

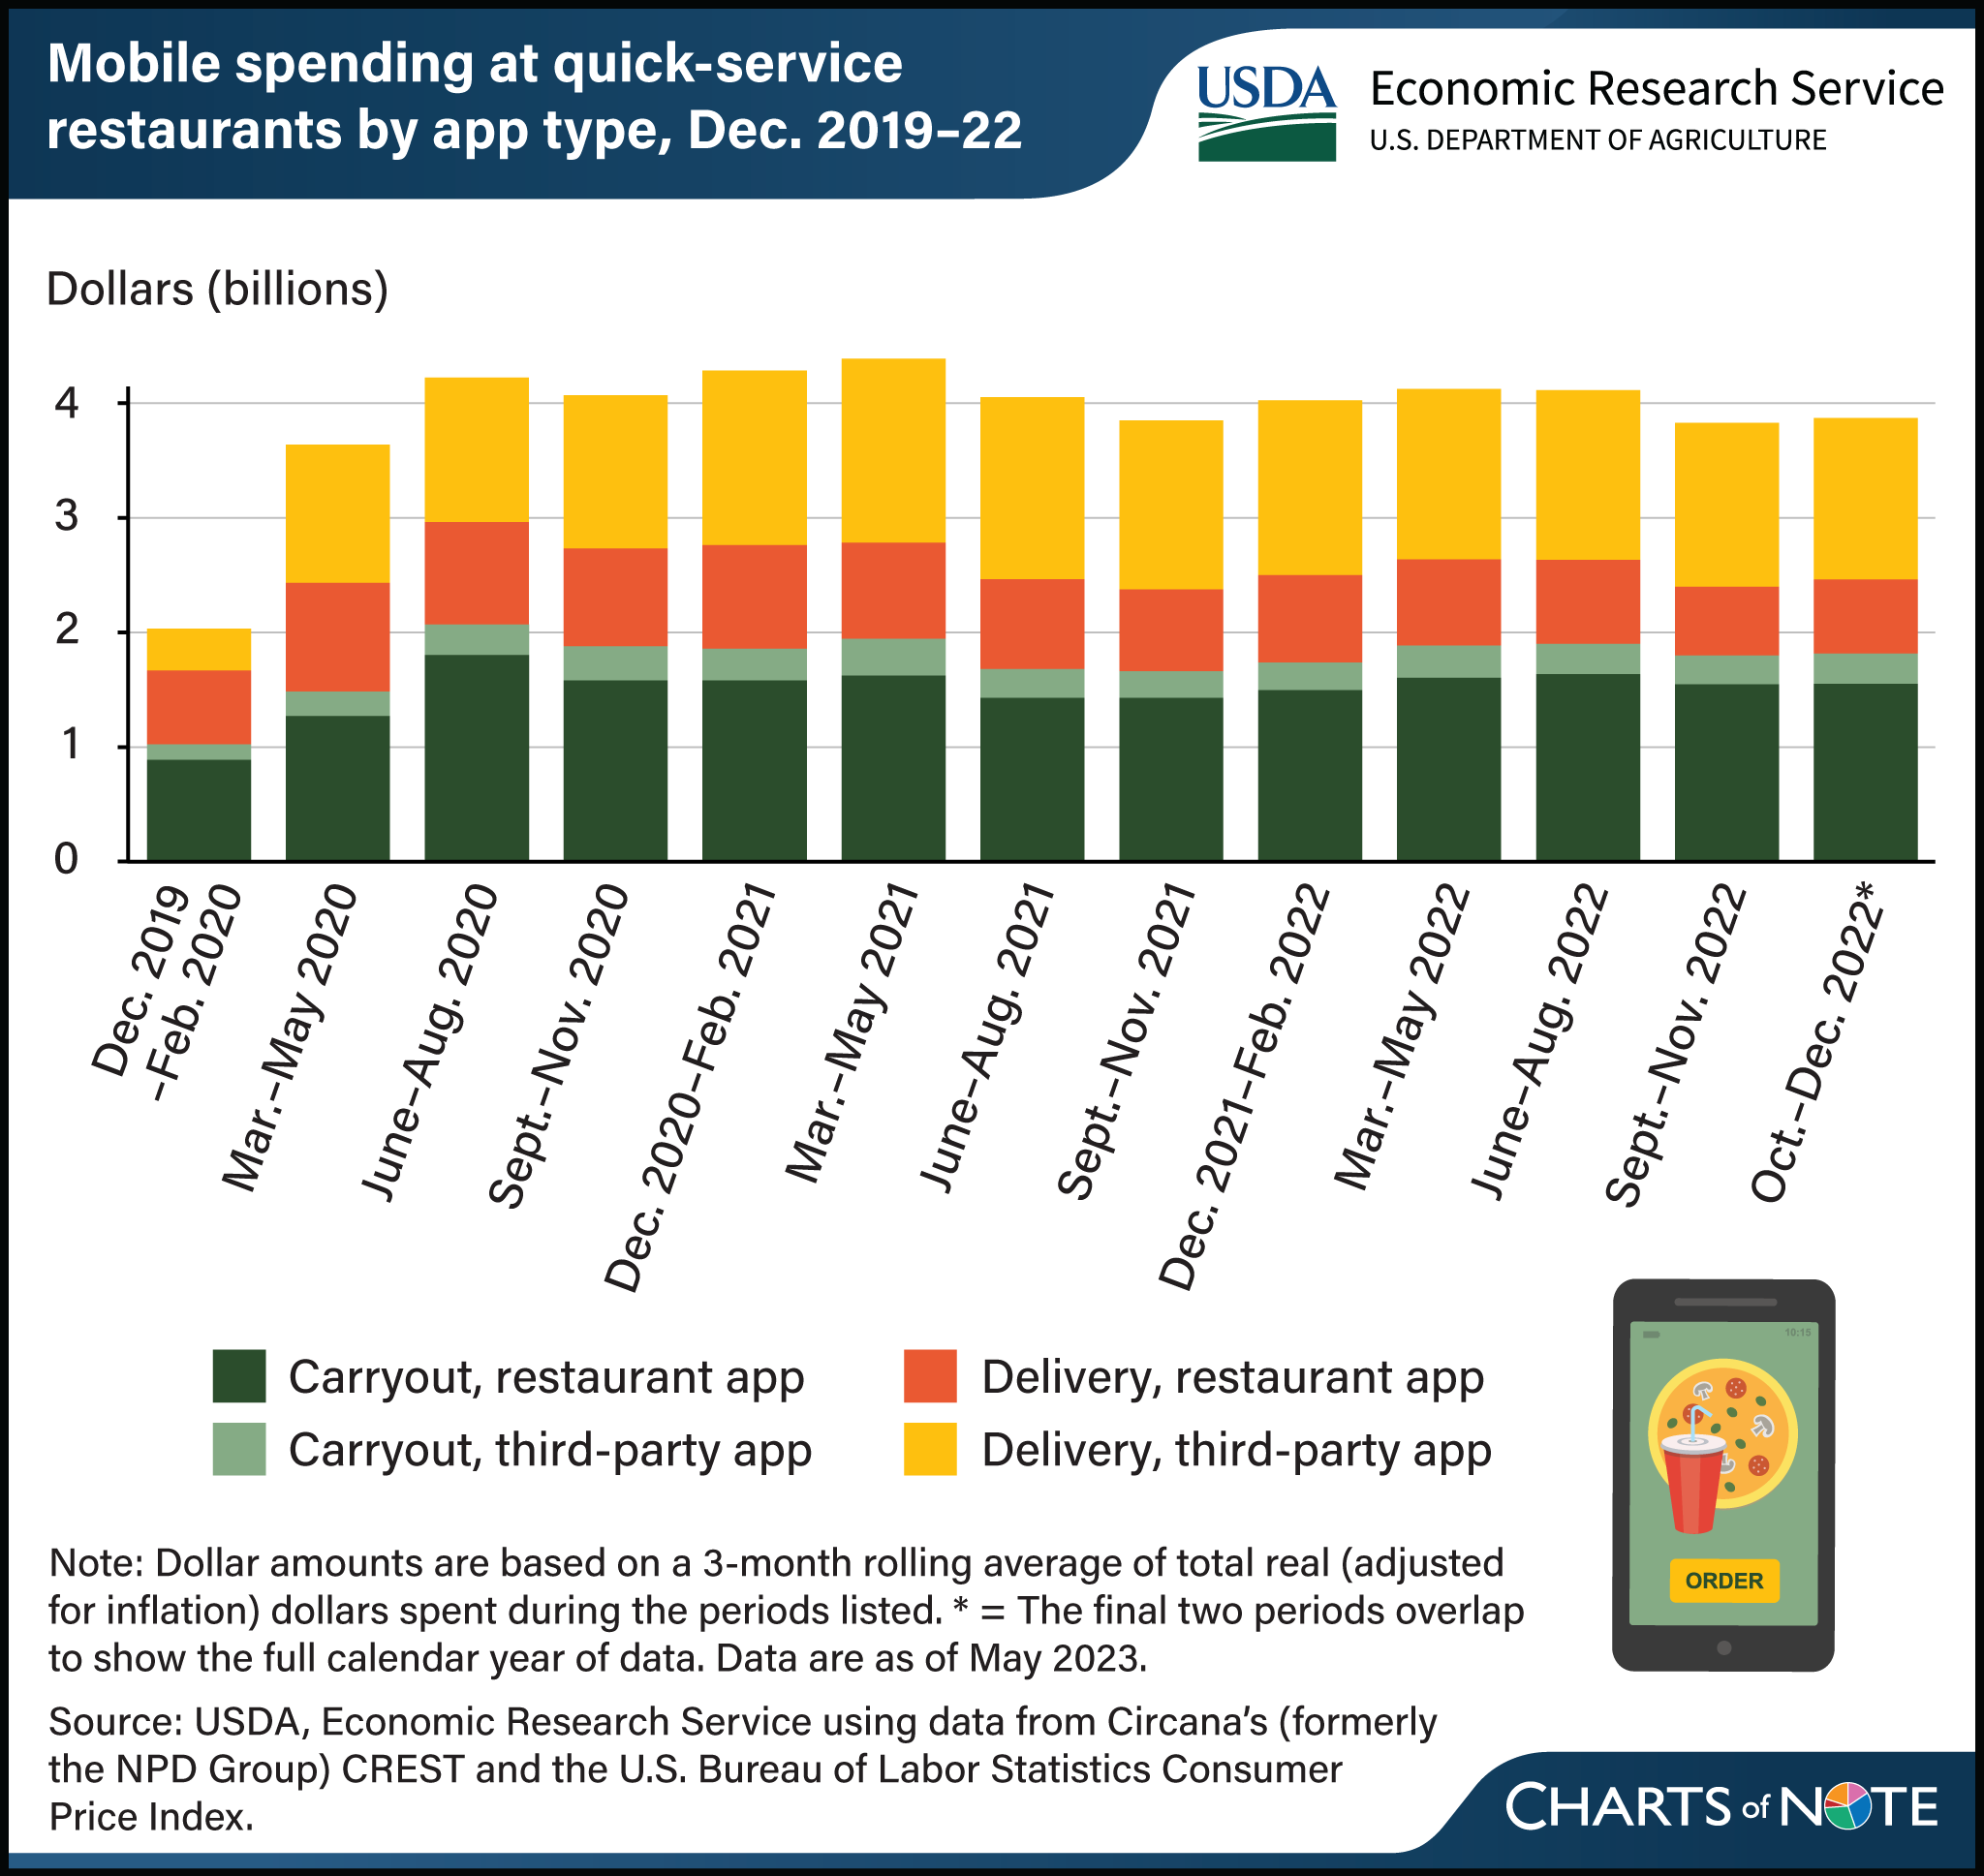
Through the end of 2022, consumer spending at quick-service restaurants on carryout and delivery remained persistently higher than the first observable Coronavirus (COVID-19) pandemic period (March–May 2020). USDA, Economic Research Service (ERS) researchers recently examined consumer spending trends on carryout and delivery from quick-service restaurants by mobile application types (including mobile website equivalents) from December 2019–February 2020 through October–December 2022. Consumers quickly adopted alternative methods to spend money on and acquire food at the beginning of the pandemic. In June–August 2020, carryout spending at quick-service restaurants via restaurant-specific apps doubled from prepandemic levels, and spending on delivery via third-party apps more than tripled. Third-party apps typically offer food from a variety of restaurants, while restaurant-specific apps are operated by the restaurant or establishment. App spending on carryout and delivery peaked in March–May 2021, reaching a total of $4.4 billion, with third-party app delivery and restaurant-specific app carryout spending each reaching about $1.6 billion. Most recently, total app spending on both carryout and delivery reached roughly $3.9 billion, where restaurant-specific carryout spending and third-party app delivery spending accounted for $1.6 and $1.4 billion, respectively. This chart appears in the ERS Amber Waves article, Pandemic-Related Increase in Consumer Restaurant Spending Using Mobile Apps Continued Through 2022, published January 2024.

