

Retail food price inflation subsided across categories in 2023
- by Megan Sweitzer
- 1/25/2024
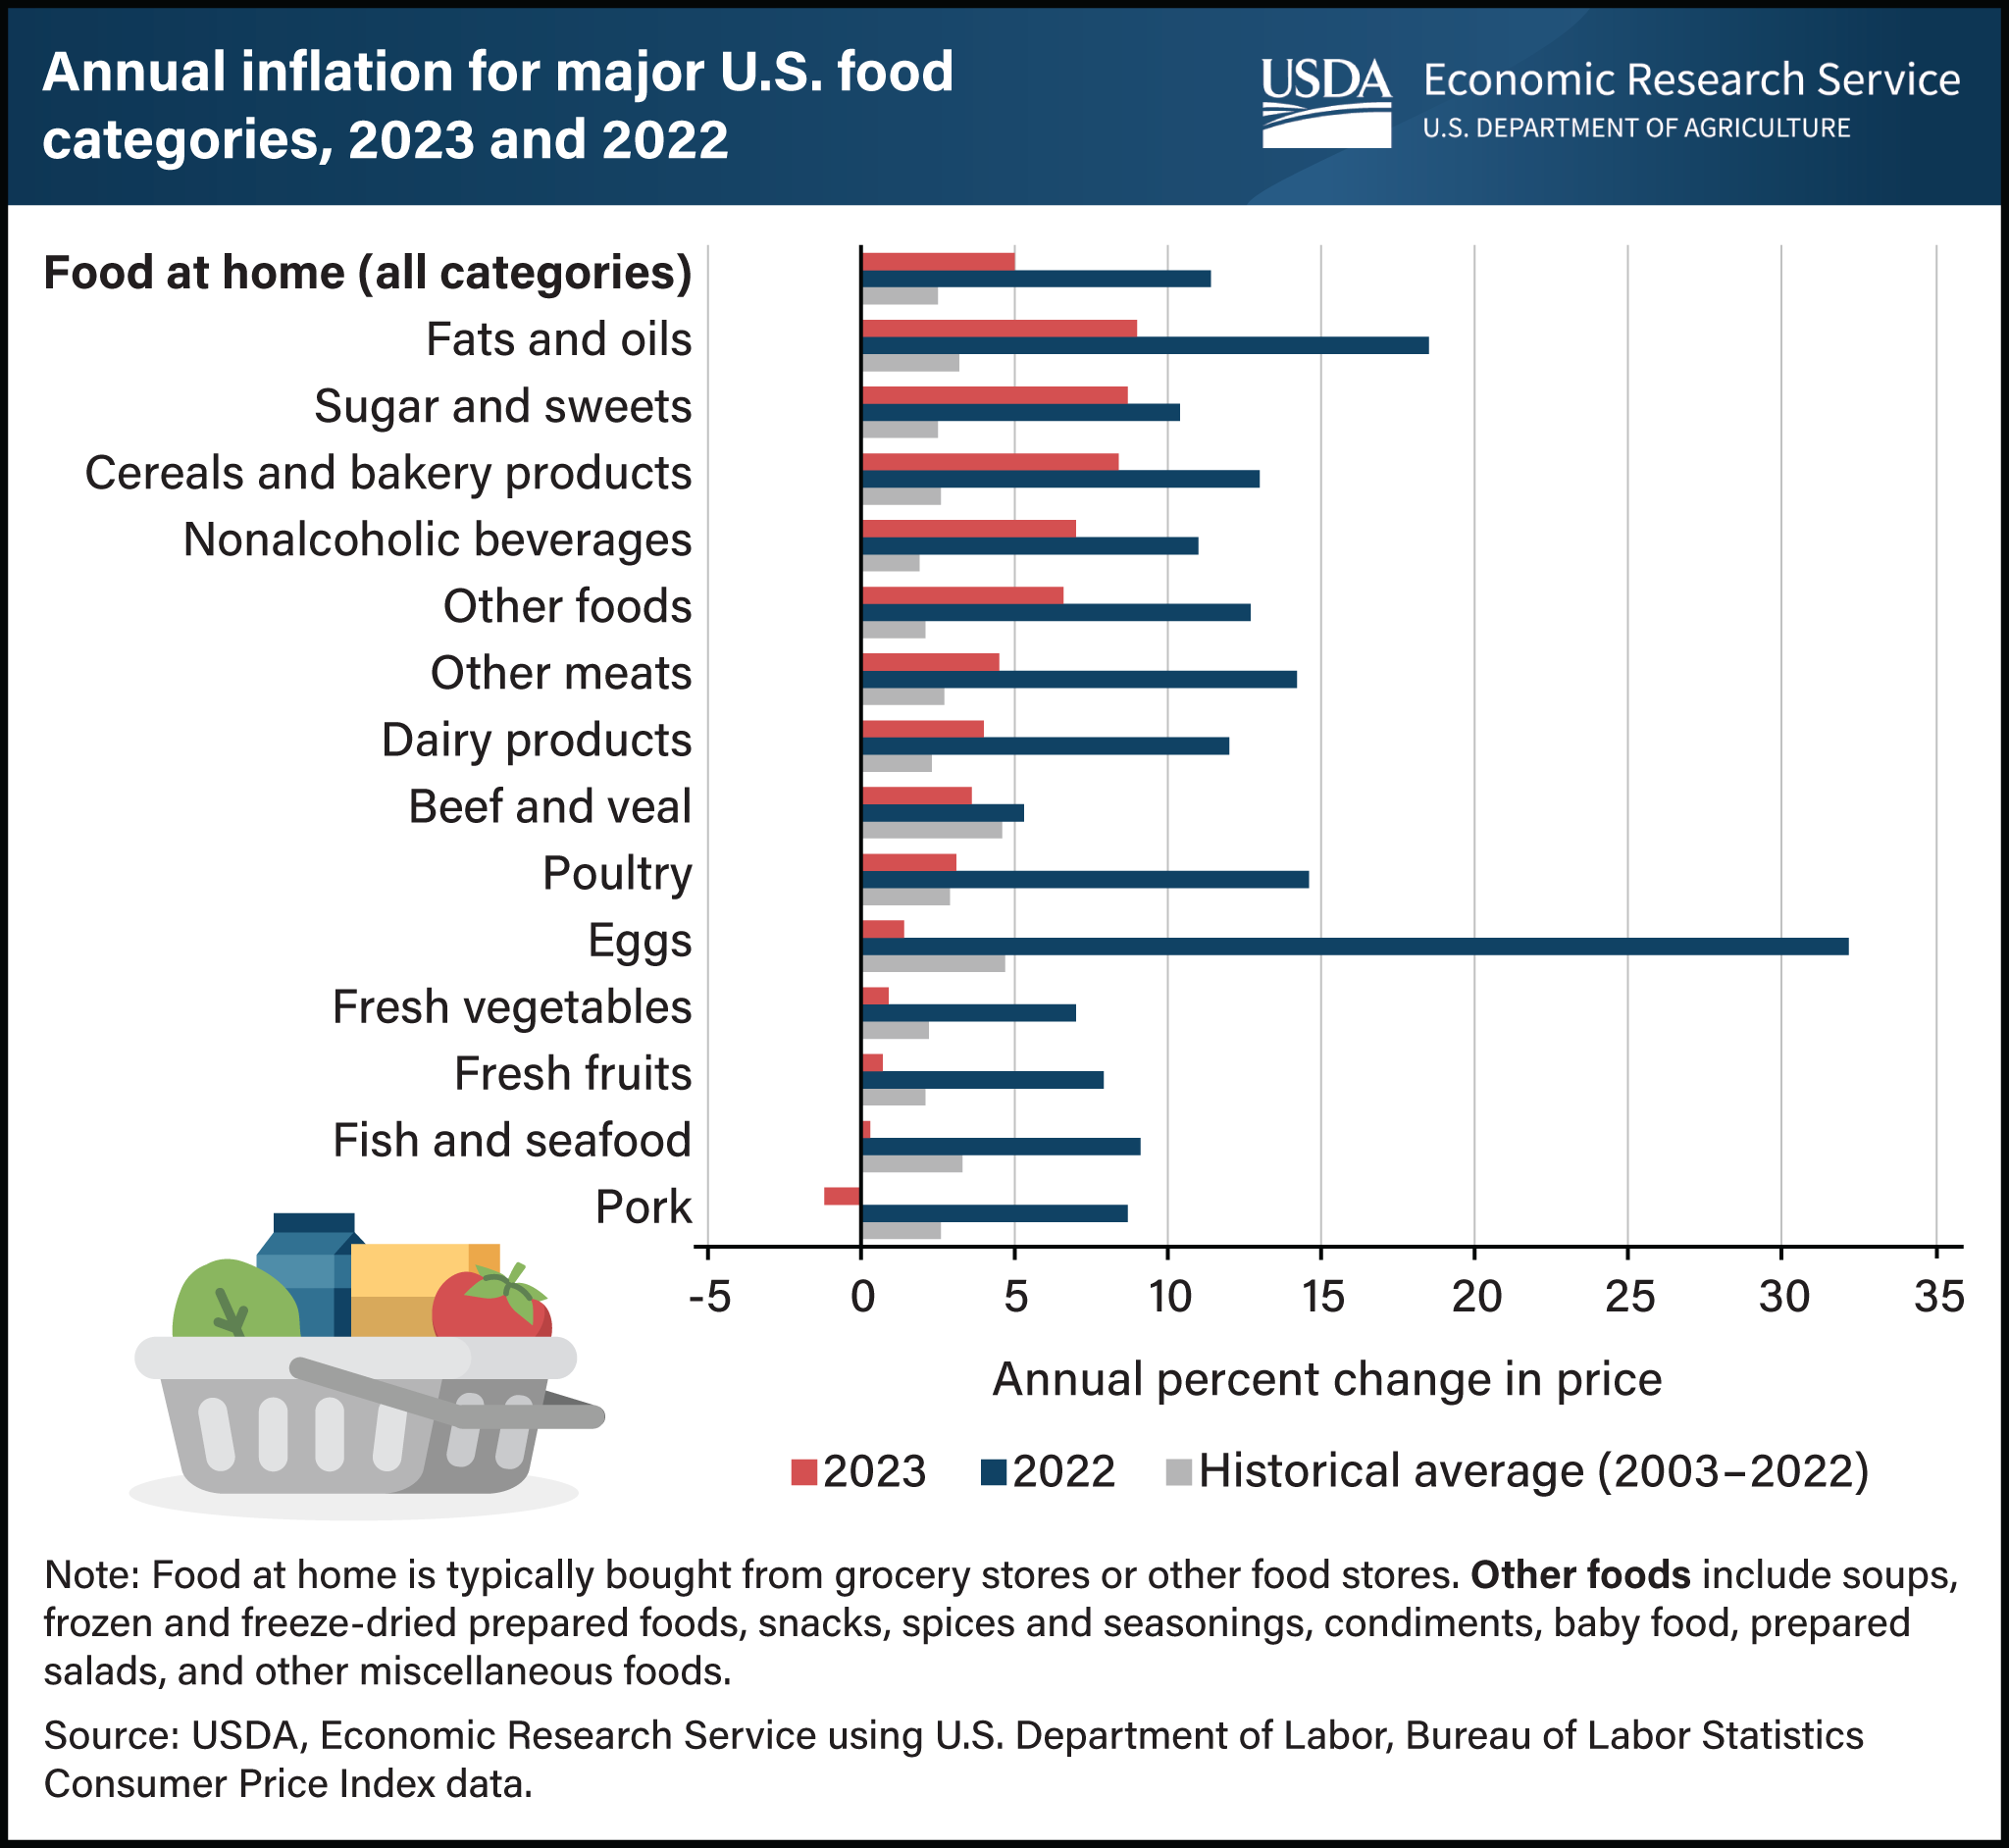
Food-at-home prices increased by 5.0 percent in 2023, much lower than the growth rate in 2022 (11.4 percent) but still double the historical annual average growth from 2003 to 2022 (2.5 percent). All product categories shown grew more slowly in 2023 compared with 2022. Food price growth slowed in 2023 as economy-wide inflationary pressures, supply chain issues, and wholesale food prices eased from 2022. In 2023, prices for fats and oils grew the fastest (9.0 percent), followed by sugar and sweets (8.7 percent), and cereals and bakery products (8.4 percent). Pork prices declined 1.2 percent in 2023, and prices for several categories grew more slowly than their historical averages, including beef and veal (3.6 percent), eggs (1.4 percent), fresh vegetables (0.9 percent), fresh fruits (0.7 percent), and fish and seafood (0.3 percent). Egg price growth receded in 2023 after a highly pathogenic avian influenza (HPAI) outbreak affected the industry in 2022. USDA, Economic Research Service (ERS) researchers project overall food-at-home prices will decrease 0.4 percent in 2024, with a prediction interval of -4.5 to 4.0 percent. ERS tracks aggregate food category prices and publishes price forecasts in the monthly Food Price Outlook data product, updated January 25, 2024.