
SNAP participation varied across States in fiscal year 2022
- by Jordan W. Jones
- 1/3/2024
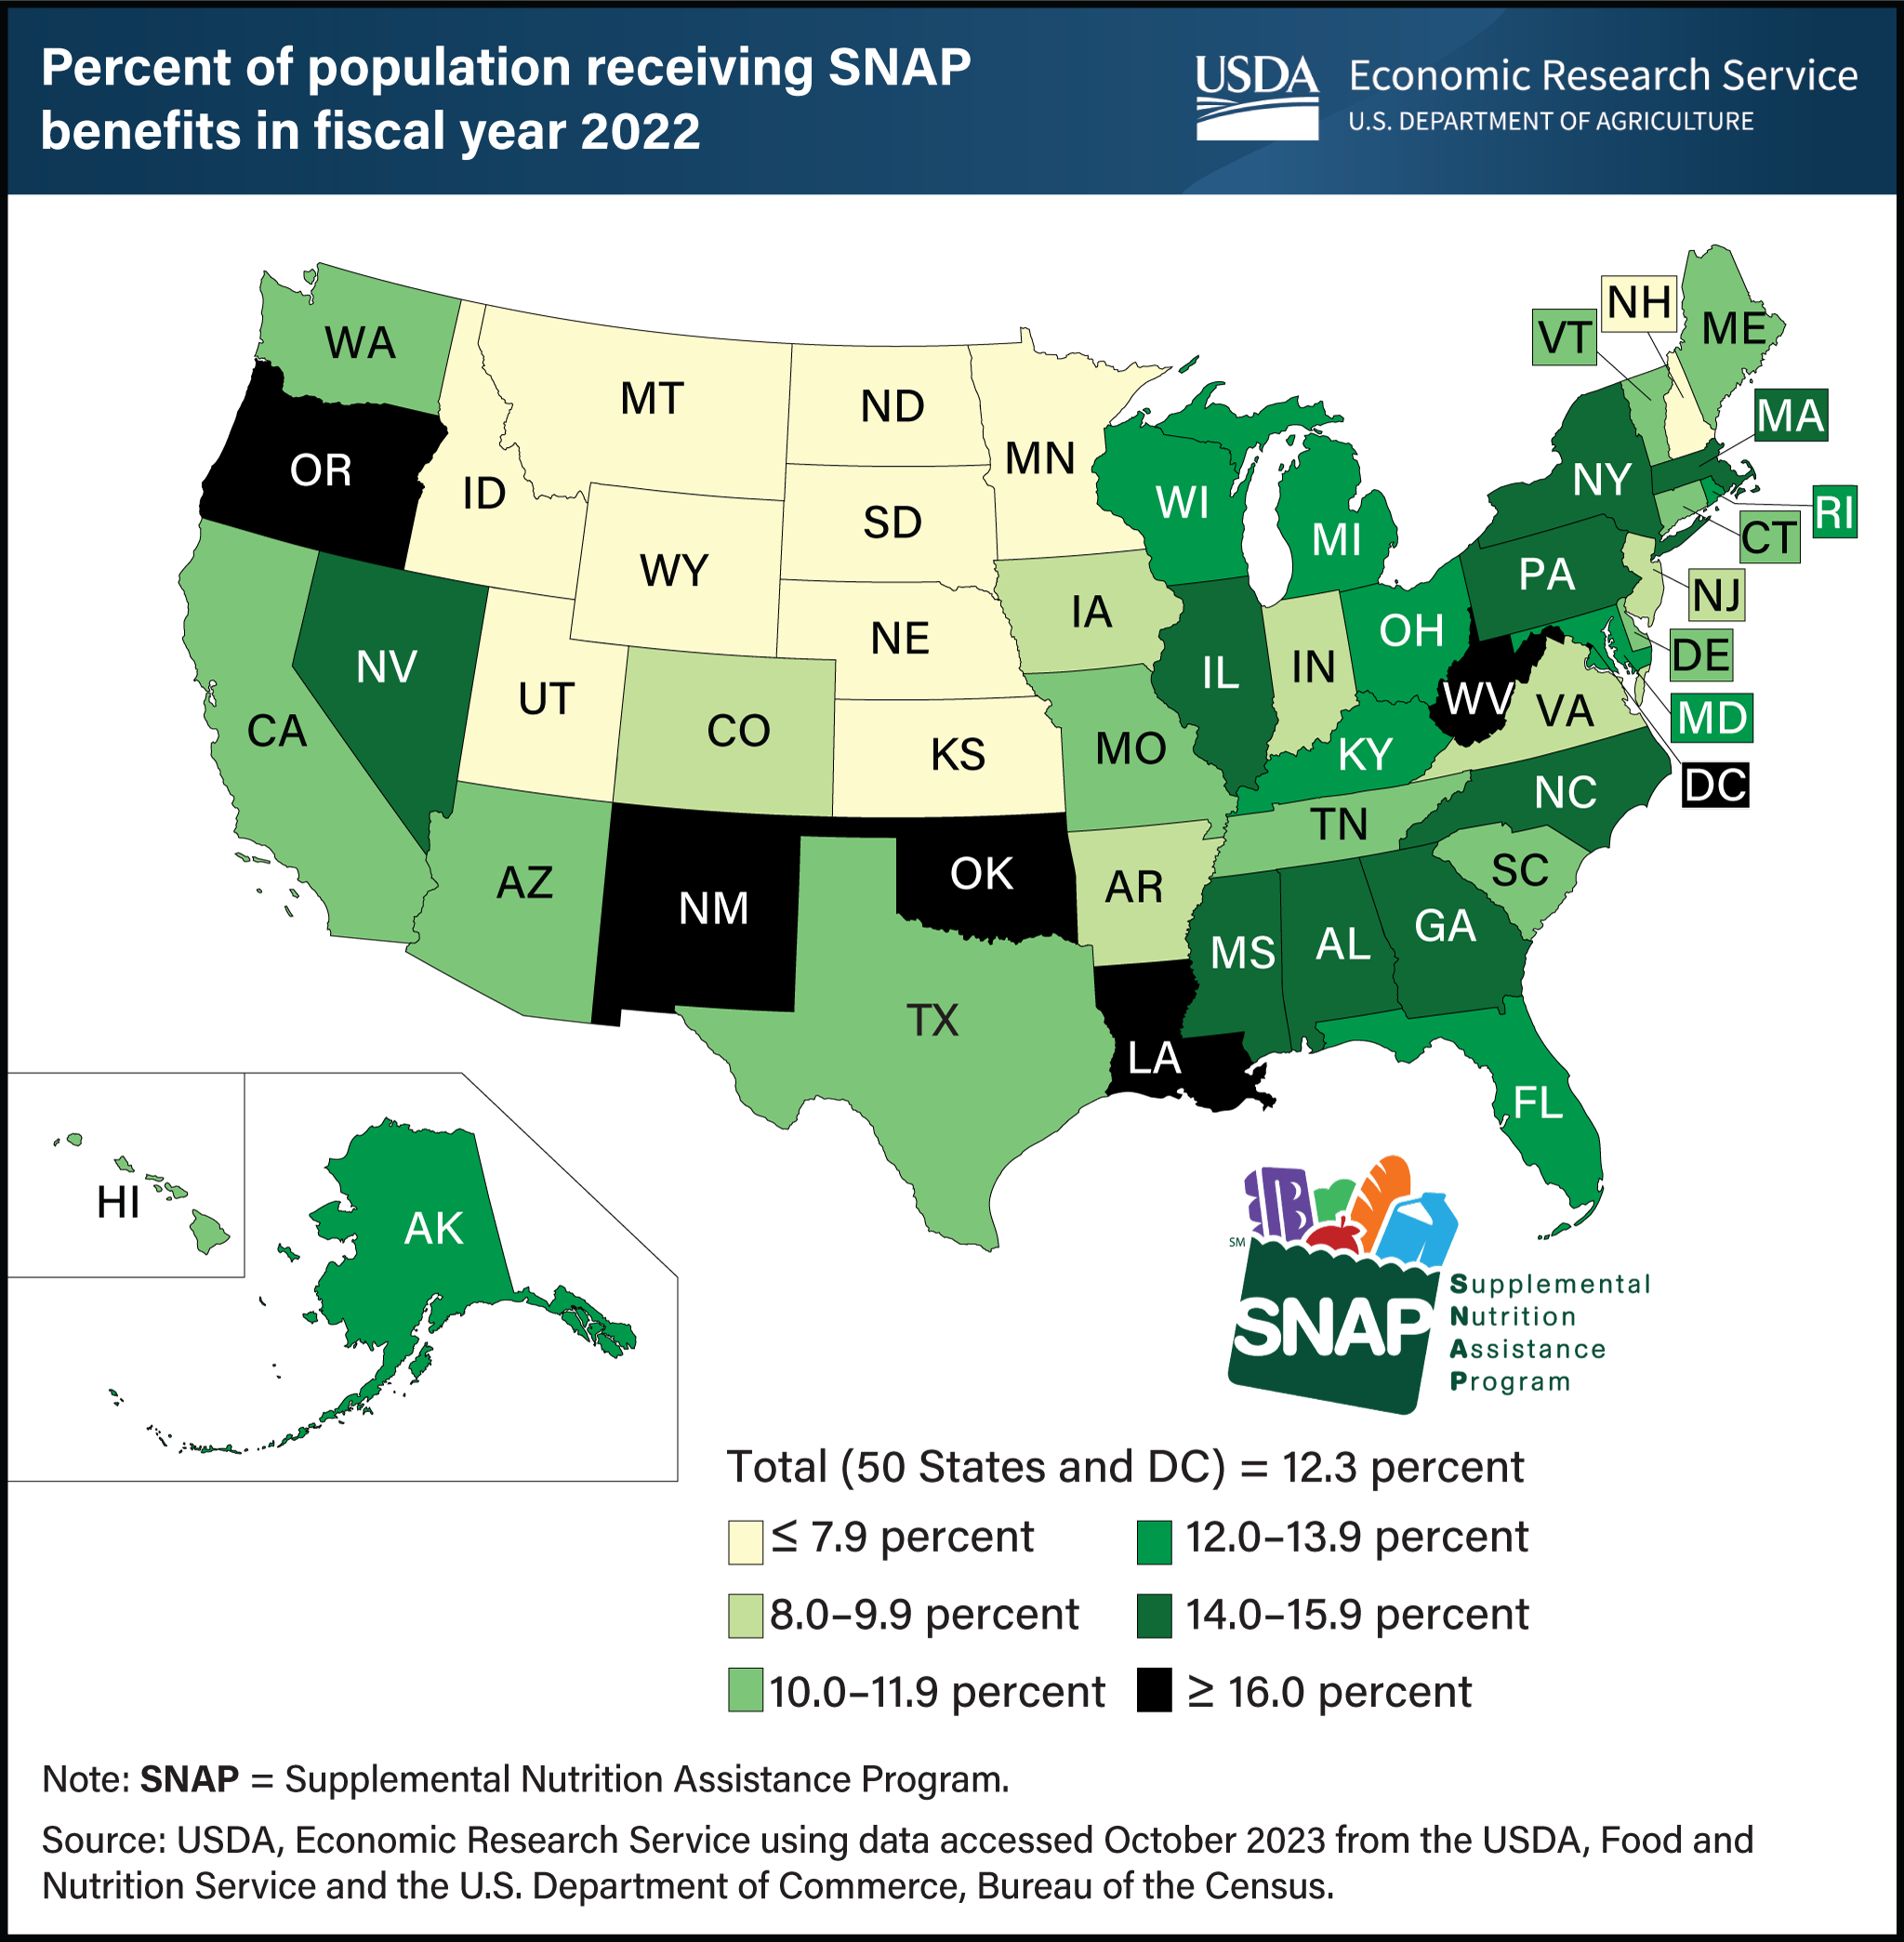
In fiscal year (FY) 2022, USDA’s Supplemental Nutrition Assistance Program (SNAP) served an average of 41.1 million people per month in the 50 States and Washington, DC. SNAP is the largest domestic nutrition assistance program, accounting for about two-thirds of USDA spending on food and nutrition assistance in recent years. The SNAP participation rate increased nationwide during the Coronavirus (COVID-19) pandemic, to a high of 12.5 percent of the resident population of the 50 States and DC in FY 2021. The FY 2022 rate fell slightly to 12.3 percent. SNAP participation varies across States because of differences in program administration and economic conditions. In FY 2022, the share of residents receiving SNAP benefits in each State ranged from as high as 24.5 percent in New Mexico to as low as 4.6 percent in Utah. In 35 States, the share was somewhere between 8 and 16 percent. This map appears in USDA, Economic Research Service’s Charting the Essentials, last updated November 2023.
We’d welcome your feedback!
Would you be willing to answer a few quick questions about your experience?