
More than half of all food-insecure households work full time
- by Laura J. Hales
- 12/7/2023
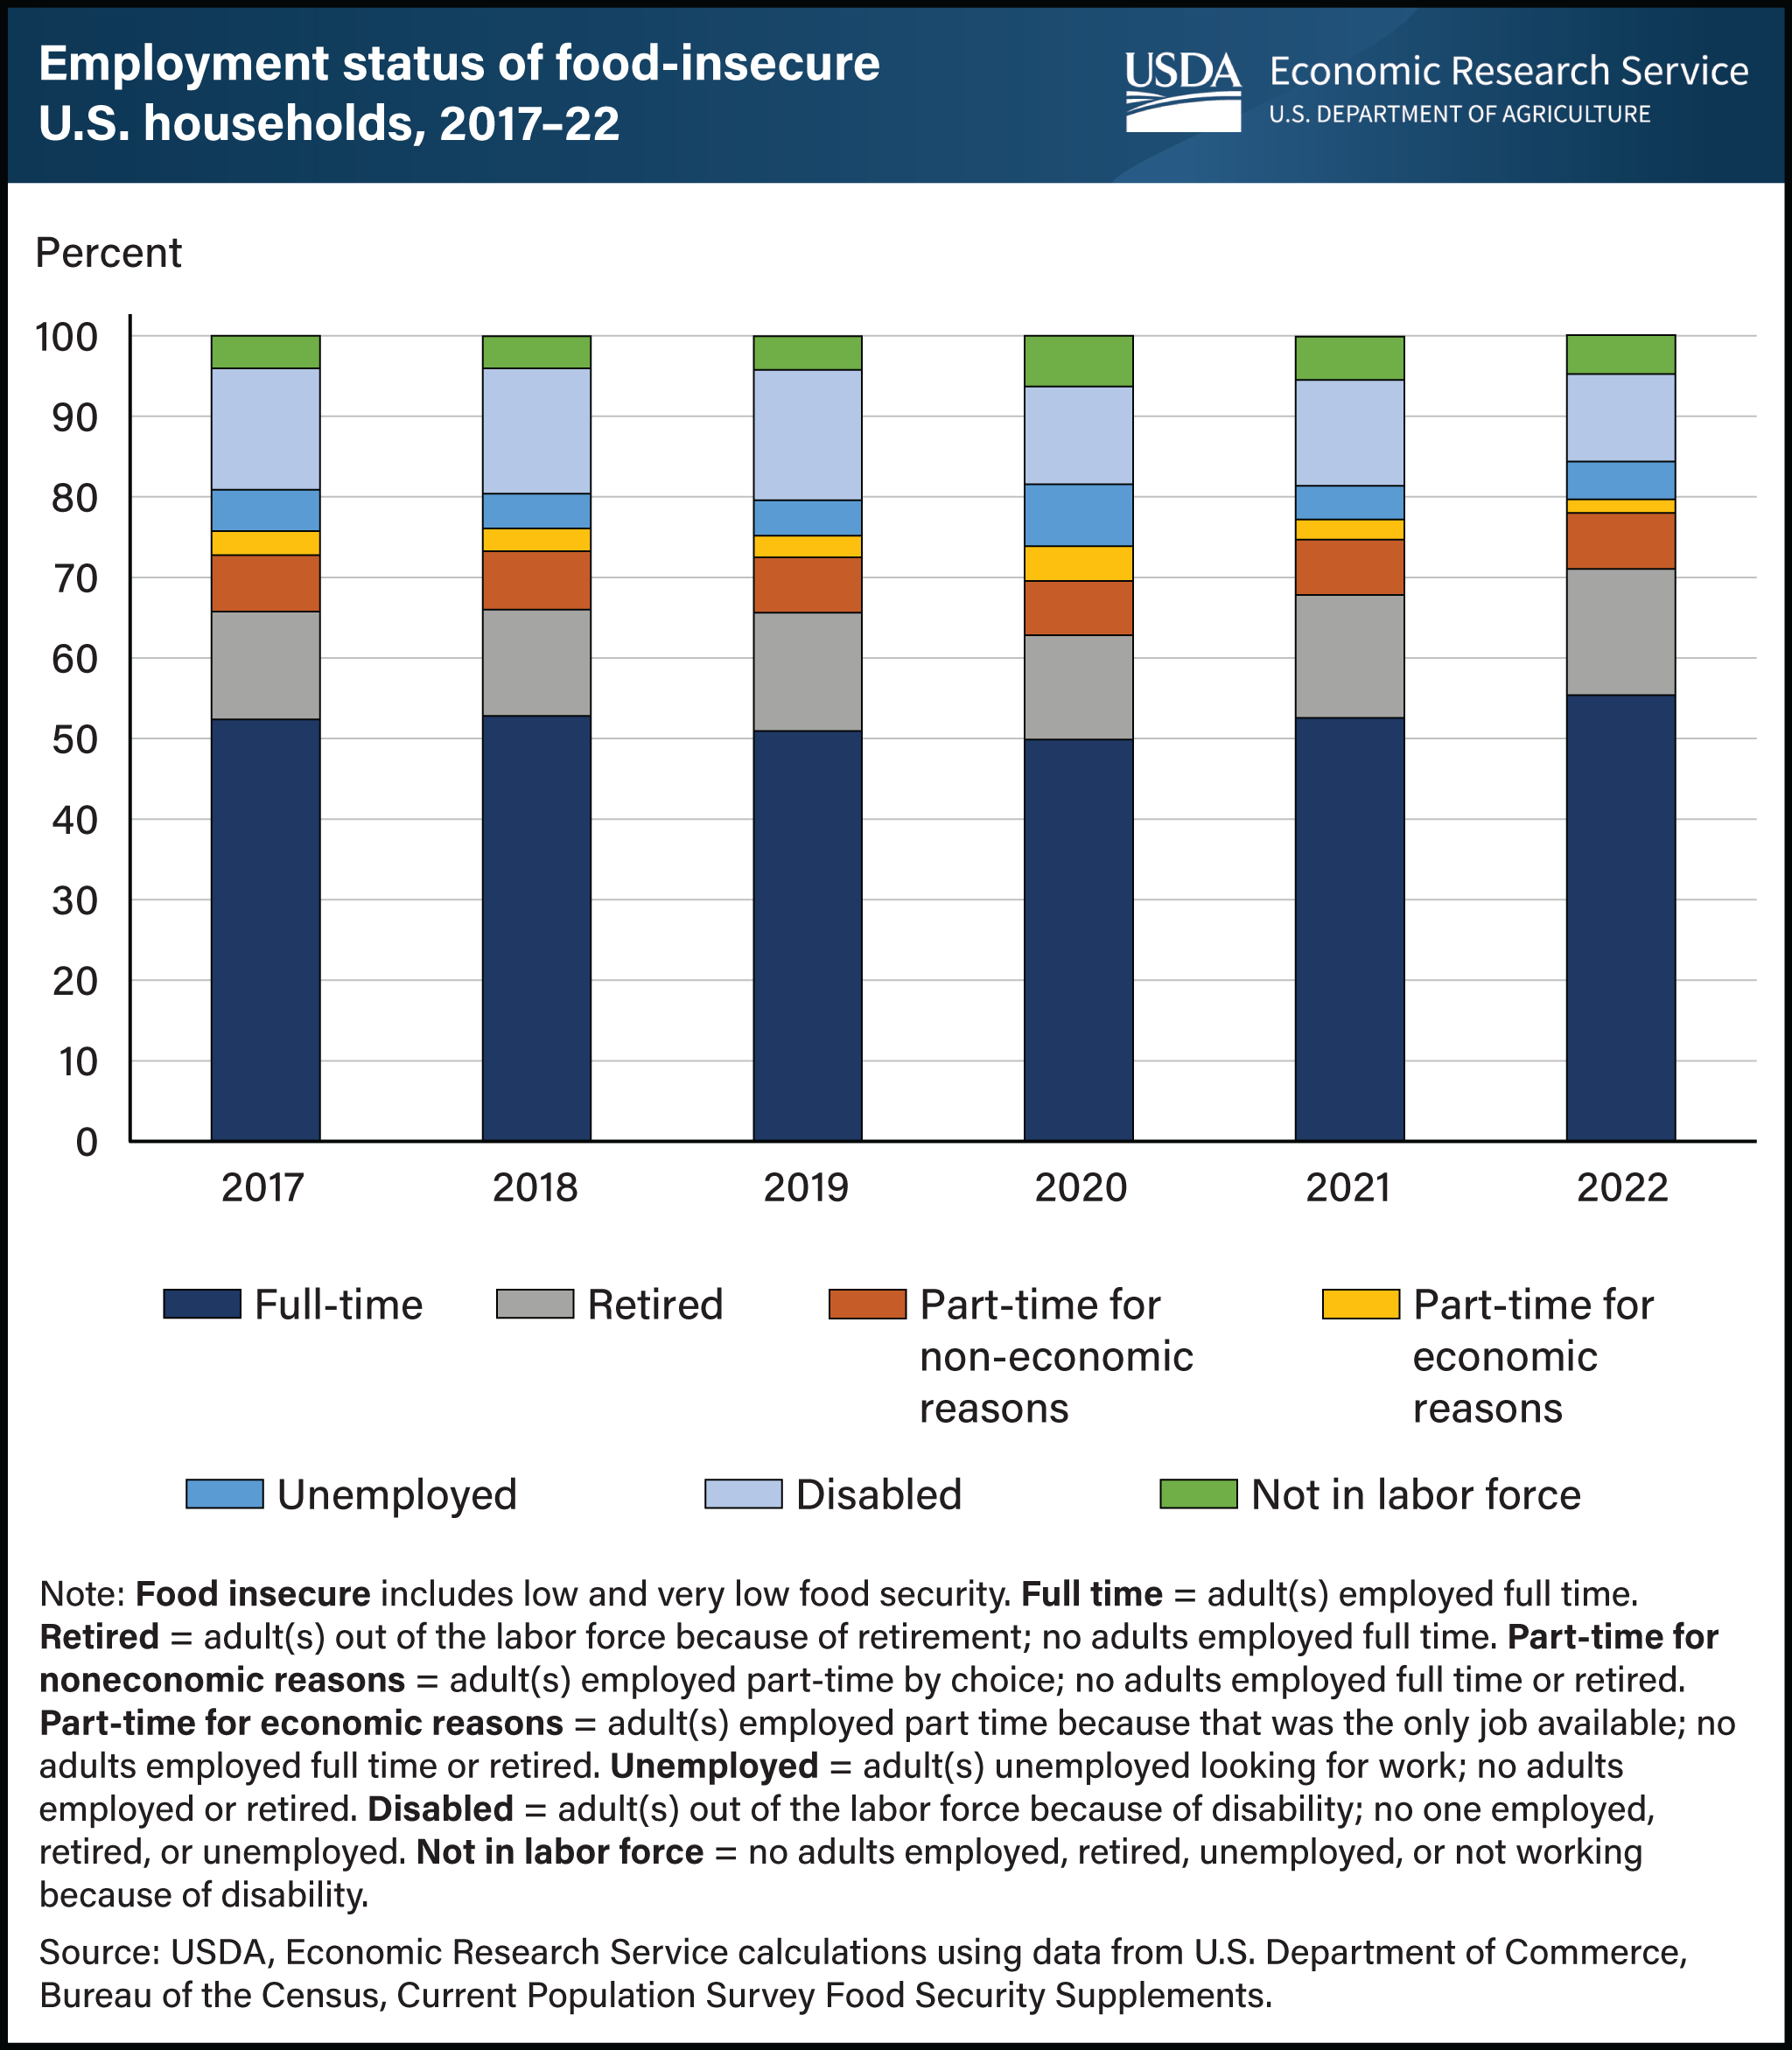
In 2022, over half of all food-insecure households in the United States had one or more adult members employed full time. USDA, Economic Research Service (ERS) monitors the prevalence of U.S. household food insecurity through an annual survey and provides information about the characteristics of food-insecure households, including their employment status. The employment status for each household is measured using the combined employment status of all adult household members. In 2022, households with adults employed full-time made up the largest share of food-insecure households at 55 percent, a share that has remained stable since 2017. Households with one or more adults employed part time because it was the only job available (called part time for economic reasons) comprised the smallest share of food-insecure households at 2 percent. The remaining food-insecure households had one or more adults who were retired, employed part time for non-economic reasons, unemployed, disabled, or not in the labor force. An interactive visualization and the underlying downloadable data for prevalence, severity (low and very low food security), and distribution of food insecurity by household employment status can be found on the ERS Interactive Charts and Highlights page.